What could happen after the Dow’s 1,000-point plunge
Following the Dow's dramatic downturn, there are now two possible forecasts for where the market is heading next. John C Burford eliminates one of them.
Get the latest financial news, insights and expert analysis from our award-winning MoneyWeek team, to help you understand what really matters when it comes to your finances.
You are now subscribed
Your newsletter sign-up was successful
Want to add more newsletters?

Twice daily
MoneyWeek
Get the latest financial news, insights and expert analysis from our award-winning MoneyWeek team, to help you understand what really matters when it comes to your finances.

Four times a week
Look After My Bills
Sign up to our free money-saving newsletter, filled with the latest news and expert advice to help you find the best tips and deals for managing your bills. Start saving today!
As I mentioned last week, the markets are throwing up some incredibly profitable opportunities, especially for swing trades. But after the heavy falls, where are the markets heading now in the short term?
Today, I want to cover the Dow, since it has made some very interesting chart patterns since I last wrote about it on 11 May.
Dow displays some textbook chart moves
Back then, I noted that the market was carving out some impressive Elliott waves and excellent Fibonacci retracements to the down waves. These should really go into a textbook on how to forecast short-term market turns with high accuracy.
MoneyWeek
Subscribe to MoneyWeek today and get your first six magazine issues absolutely FREE

Sign up to Money Morning
Don't miss the latest investment and personal finances news, market analysis, plus money-saving tips with our free twice-daily newsletter
Don't miss the latest investment and personal finances news, market analysis, plus money-saving tips with our free twice-daily newsletter
Trader tip: If you are studying Elliott waves and Fibonacci, I recommend following the Dow story as I started in my 11 May post. We can all describe chart action in hindsight, but all traders must work in real time, and that is a lot more problematic.
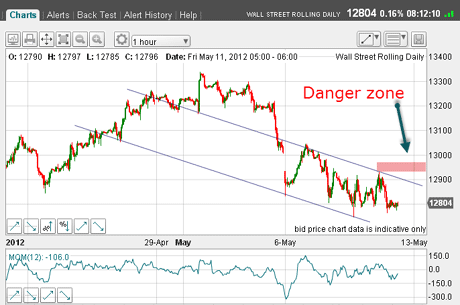
In that article, I showed an hourly chart with my tramlines:
(Click on the chart for a larger version)
As ever, I was alert to the possibility of sharp rallies. My 'danger zone' lay just above the upper tramline.
If the market had rallied into this zone, this would fundamentally change my Elliott wave labelling.
Why? Because instead of an ongoing five-wave down move I had pencilled in which would confirm a larger down trend the shape of the decline off the 13,340 1 May top would look more like an A-B-C, which is corrective to the main trend (up).
Also, if the market rallied, there would be a gaping positive momentum divergence on the hourly chart. This would add fuel to the bullish fire!
Thus my short positions can be protected by setting my buy-stops in this danger zone. That is the sensible play.
Two alternative forecasts for the Dow
So I have two alternative forecasts: An A-B-C correction with the main bull trend resuming, or a resumption of the down-trend in a five-wave pattern (to be completed). These lead to two very different outcomes!
By eliminating one of these potentials, I can place my bets on the remaining one. For a trader, what more could I ask of a system?
As it happened, the market did not rally into my danger zone, and I could then abandon the A-B-C idea. The odds swung to a declining market.
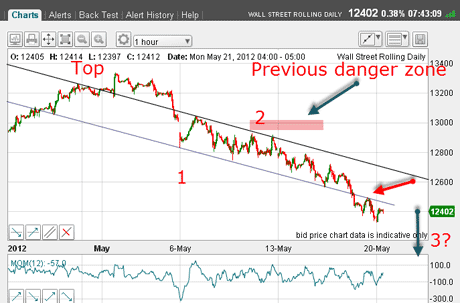
Here is an update of this chart as of this morning:
(Click on the chart for a larger version)
The market plunged through my lower tramline a very bearish development.
But just admire the rally that followed and where it turned it kissed the underside (red arrow) and backed off in a 'scalded cat bounce'. Some more textbook offerings from the Dow!
I have placed the tentative Elliott labels as shown. If correct, the Dow is in the third wave down.
So what is the potential for more declines from here, or should I expect a decent rally? To gain a clue, let's back up and look at the longer-term picture.
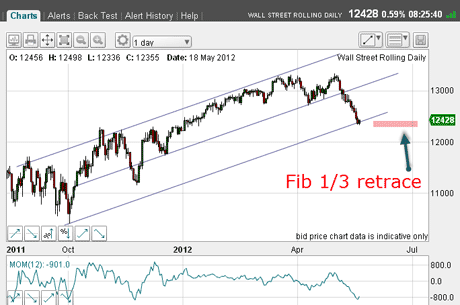
Here is the daily chart going back to the October lows:
(Click on the chart for a larger version)
The descent from the 1 May high has been spectacular, has it not? But I believe caution is advised here, and I will explain why.
Three reasons to expect a Dow rally from here
First, the market last week declined to an exact Fibonacci 1/3 retrace of the big bear market rally off the October low. As we know, Fibonacci levels are areas of potential support. The 1/3 level doesn't get much publicity, but is one to respect.
Second, just look at where the market dropped to right to my lowest tramline!Remember, I can draw this line equidistant from the upper ones. That line I had in place ever since the market broke below the centre tramline. The key to this line is that it passes right through the October low, and is a very significant line.
Trader tip: When you see a tramline break, try looking for the next tramline and use it as your possible target. I urge you to look at my short tutorial videos for more on tramlines.
Third, daily momentum is very oversold and all things being equal (they rarely are), a rally appears likely.
So I have three factors that tell me to expect a rally from these levels.
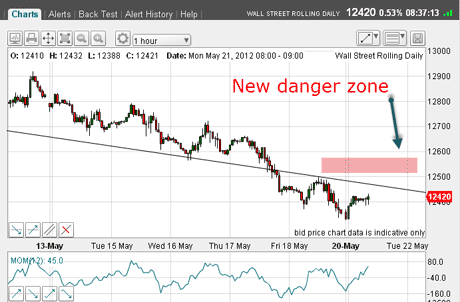
How, then, should I protect my short trades? Let's go back to the current hourly chart:
(Click on the chart for a larger version)
Note the potential positive momentum divergence at this morning's low. This could warn of a rally ahead as the selling could be running out of steam here.
So my new danger zone is just above the tramline and above the 12,500 level of Friday's high. That's where I'd look to have my buy stops. A poke above this area should indicate a short-term low is in place and a more substantial rally awaits.
One other factor I haven't mentioned investor sentiment. That has turned very negative, as we should expect after a 1,000 point two-week plunge. But has this set the stage for a decent rally? The odds seem to agree.
I hope to cover the euro later this week, as a similar potential holds for a rally.
If you're a new reader, or need a reminder about some of the methods I refer to in my trades, then do have a look at my introductory videos:
The essentials of tramline trading
An introduction to Elliott wave theory
Advanced trading with Elliott waves
Don't miss my next trading insight. To receive all my spread betting blog posts by email, as soon as I've written them, just sign up here .
Get the latest financial news, insights and expert analysis from our award-winning MoneyWeek team, to help you understand what really matters when it comes to your finances.
John is is a British-born lapsed PhD physicist, who previously worked for Nasa on the Mars exploration team. He is a former commodity trading advisor with the US Commodities Futures Trading Commission, and worked in a boutique futures house in California in the 1980s.
He was a partner in one of the first futures newsletter advisory services, based in Washington DC, specialising in pork bellies and currencies. John is primarily a chart-reading trader, having cut his trading teeth in the days before PCs.
As well as his work in the financial world, he has launched, run and sold several 'real' businesses producing 'real' products.
-
 Barings Emerging Europe trust bounces back from Russia woes
Barings Emerging Europe trust has added the Middle East and Africa to its mandate, delivering a strong recovery, says Max King
-
 How a dovish Federal Reserve could affect you
Trump’s pick for the US Federal Reserve is not so much of a yes-man as his rival, but interest rates will still come down quickly, says Cris Sholto Heaton