The Dow follows my Elliott wave roadmap
The Dow Jones is throwing up some absolutely classic examples in trading using John C Burford's simple chart-based methods.
Get the latest financial news, insights and expert analysis from our award-winning MoneyWeek team, to help you understand what really matters when it comes to your finances.
You are now subscribed
Your newsletter sign-up was successful
Want to add more newsletters?

Twice daily
MoneyWeek
Get the latest financial news, insights and expert analysis from our award-winning MoneyWeek team, to help you understand what really matters when it comes to your finances.

Four times a week
Look After My Bills
Sign up to our free money-saving newsletter, filled with the latest news and expert advice to help you find the best tips and deals for managing your bills. Start saving today!
Where to start? Dow, gold, euro? Everything's so exciting in my favourite markets! This is a brilliant time for traders to make money in the markets if you have a strategy.
I'm going to go with the Dow today. MoneyWeek Trader is about showing you how you can successfully trade using the strategy I've spent years developing.
And the Dow is throwing up some absolutely classic examples in trading using my simple chart-based methods. In fact, all three pillars of my strategy get a good look-in today let's get right to it.
MoneyWeek
Subscribe to MoneyWeek today and get your first six magazine issues absolutely FREE

Sign up to Money Morning
Don't miss the latest investment and personal finances news, market analysis, plus money-saving tips with our free twice-daily newsletter
Don't miss the latest investment and personal finances news, market analysis, plus money-saving tips with our free twice-daily newsletter
We have tramlines, Fibonacci retracements, and in particular, Elliott waves.
Seeing the market drive along following my Elliott wave roadmap is thrilling, isn't it? I'll show you what I mean.
Dow follows the script and heads lower
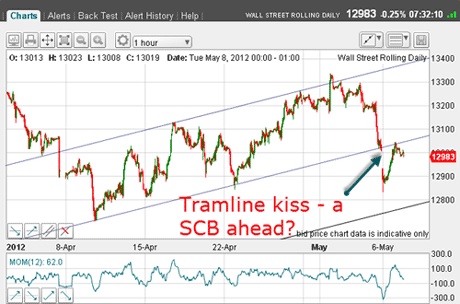
On 8 May, I believe I made a strong case for expecting a move lower in the Dow.
If you recall, I had observed the rally to the underside of a tramline, and was wondering if the market would experience a scalded cat bounce down from the kiss.
This was the picture back then:
(Click on the chart for a larger version)
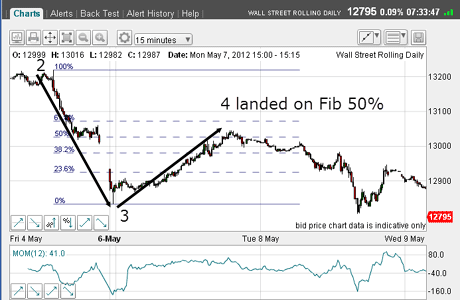
One of the reasons I suspected the rally was ending at the 13,000 area was the Fibonacci 50% retrace of the third wave down.
I saw that as a good spot to enter short trades using a close protective stop.
Let me show you how it played out:
(Click on the chart for a larger version)
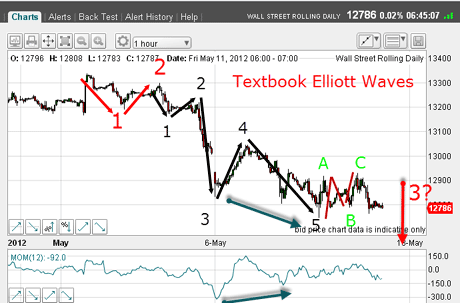
The rally to wave 4 did indeed turn there and the market proceeded to decline to make a fifth wave at a new low in fact, it made sure of the new low by making two of them!
So here is the current picture:
(Click on the chart for a larger version)
The fifth wave was made on a positive momentum divergence(blue arrows), and so I expected a rally up ahead.
And we got that rally and in the classic A-B-Cform! How pretty.
The big question that must be at the top of every trader's list is:
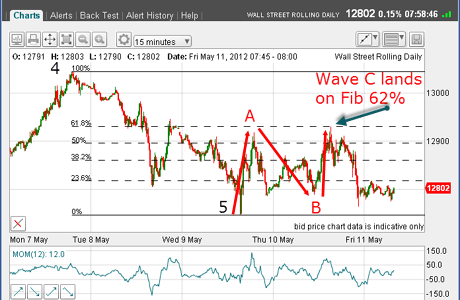
How high will the Dow go before turning?
A large rally would indicate to me that my large third wave idea was probably wrong. But a shallow rally would indicate weakness and my third wave idea is on track.
And that is where my trusty Fibonacci tool proves its worth:
(Click on the chart for a larger version)
Just admire how the C wave is seen to reach the Fibonacci 62% retrace of the fifth wave as it poked just above the A wave high. A perfect shot!
OK, so far, so good. The market is behaving as it should.
But it never pays to get complacent! We must always protect against hubris no great trader suffers from the vice of being complacent.
Great traders are humble in front of the markets. And a great trader is a trader that has made their share of losses brought about by hubris (and other factors), and learned the lessons the painful and best way.
So what is the road ahead?
If my larger Elliott wave count is correct, we are still in a large third wave down.
Confirmation would come from a move down below the fifth wave low at 12,750.
But what could upset the apple cart?
One event would be a rally from here! Let's see if the charts can give us any clues.
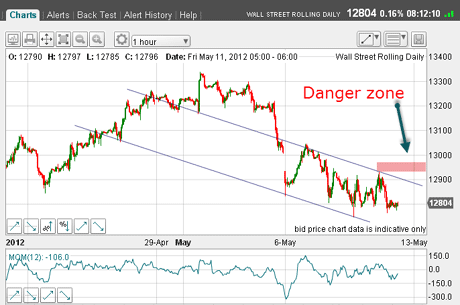
I have drawn a solid-looking tramline pair:
(Click on the chart for a larger version)
The tramlines contain the most recent highs and lows and both have prior pivot points (PPPs).
Trader tip: Because I encourage even demand! that traders think for themselves, why not have a go at finding more tramlines and then do your own analysis. I can assure you that there are plenty there. I'm planning to make available a video recording of my recent workshop, which should really help you hone these skills. It's being produced at the moment I'll let you know when it's ready.
OK, back to the charts and, looking at the one above, a rally above my upper tramline would put a big question mark over my large third wave idea. It would not destroy it, but I would be tempted to exit the market until the fog cleared.
After all, my objective is not to be right, but to conserve and make money. That's key to lasting in trading which is why I attach so much importance to money management, as workshop attendees will know!
So, that's how I see the Dow at the moment. Exciting times, aren't they? Are you seeing these trading opportunities? Let me know your thoughts.
Ignore the noise about gold focus on the charts!
My Wednesday article on goldhas provoked some interesting comments, and today's news that JPMorgan bank has lost $2bn has also provoked comment elsewhere. Many gold bulls believe this bank has been selling gold on the orders of the Fed to keep the price under check.
My stance? I will always let my charts dictate my actions. I will not blame anyone other than myself for my wrong trades period. I don't care if the Fed is manipulating the market or not (I tend to disbelieve conspiracy theories) all I care about is: Can I make money in this market?
That is my advice to any trader who asks. After all, that's what we're here for isn't it?
And that is my aim in these articles to show how you can learn my methods and use them to your own advantage. Let me know how we're doing!
If you're a new reader, or need a reminder about some of the methods I refer to in my trades, then do have a look at my introductory videos:
The essentials of tramline trading
An introduction to Elliott wave theory
Advanced trading with Elliott waves
Don't miss my next trading insight. To receive all my spread betting blog posts by email, as soon as I've written them, just sign up here .
Get the latest financial news, insights and expert analysis from our award-winning MoneyWeek team, to help you understand what really matters when it comes to your finances.
John is is a British-born lapsed PhD physicist, who previously worked for Nasa on the Mars exploration team. He is a former commodity trading advisor with the US Commodities Futures Trading Commission, and worked in a boutique futures house in California in the 1980s.
He was a partner in one of the first futures newsletter advisory services, based in Washington DC, specialising in pork bellies and currencies. John is primarily a chart-reading trader, having cut his trading teeth in the days before PCs.
As well as his work in the financial world, he has launched, run and sold several 'real' businesses producing 'real' products.
-
 MoneyWeek Talks: The funds to choose in 2026
Podcast Fidelity's Tom Stevenson reveals his top three funds for 2026 for your ISA or self-invested personal pension
-
 Three companies with deep economic moats to buy now
Opinion An economic moat can underpin a company's future returns. Here, Imran Sattar, portfolio manager at Edinburgh Investment Trust, selects three stocks to buy now