Gold breaks an important tramline and heads lower
Gold is breaking out if its tramlines – and that spells trouble, says John C Burford. Here, he explains why he's about to get serious shorting gold.
Get the latest financial news, insights and expert analysis from our award-winning MoneyWeek team, to help you understand what really matters when it comes to your finances.
You are now subscribed
Your newsletter sign-up was successful
Want to add more newsletters?

Twice daily
MoneyWeek
Get the latest financial news, insights and expert analysis from our award-winning MoneyWeek team, to help you understand what really matters when it comes to your finances.

Four times a week
Look After My Bills
Sign up to our free money-saving newsletter, filled with the latest news and expert advice to help you find the best tips and deals for managing your bills. Start saving today!
Every gold bull on the planet must be scratching his or her head right now, trying to figure out why gold stocks have been so chronically under-performing the metal itself.
It's giving them sleepless nights, I'm sure.
The assumption is that gold is in a bull market. Therefore, as surely as night follows day, that should be enough to pull gold shares up by their bootstraps eventually.
MoneyWeek
Subscribe to MoneyWeek today and get your first six magazine issues absolutely FREE

Sign up to Money Morning
Don't miss the latest investment and personal finances news, market analysis, plus money-saving tips with our free twice-daily newsletter
Don't miss the latest investment and personal finances news, market analysis, plus money-saving tips with our free twice-daily newsletter
But here's what I think and it answers the conundrum. I reckon gold stocks have been actually leading the way down! They were/are the canary in the coal (gold) mine.
To put it another way, instead of asking why gold stocks were lagging, the correct question was: Why is gold holding up so well in the face of declining gold shares?
Why I'm about to get serious shorting gold
As long-time MoneyWeek Trader readers will know, I've been a gold bear since the $1,920 highs were put in last summer. Before that, even.
If you were reading my emails at the time, you may recall that I had terrific fun shorting the bull market. And very often I was getting away with it, as my short trades were taken near market highs and I was quick to take profits.
But now, I reckon I can get really serious in shorting gold. Let's look at what's been going on
The last time I covered gold, I was looking for a possible rally up above a tramline to perhaps the $1,720 level.
My tentative long trade was taken out at $1,650 (see my 30 April article) for a small loss. That is where I reversed my position and went short.
And as we know, gold did not hit any of my upside targets and retreated instead. In fact, when I re-drew my tramlines, the market had not penetrated the upper one!
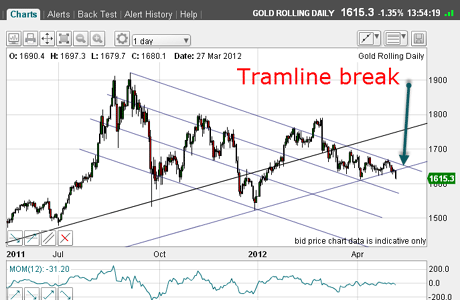
This tramline break spells trouble for gold
So where is gold now? These are my new tramlines on the daily chart taken yesterday:

(Click on the chart for a larger version)
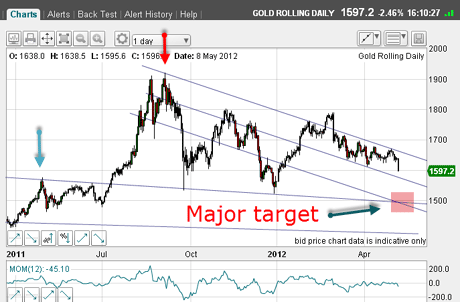
I can draw my highest line from the $1,920 top now (red arrow in my second chart below), and my second tramline down clips the three March-April lows.
But look at my pair of up-sloping tramlines on the chart above. The lower one I put in first from the major 29 December low to the four recent lows. And just admire the lovely prior pivot point (PPP) on the upper one at the July low.
Notice how the market found support at the crossing of the tramlines on the 11 April low at $1,610.
But yesterday, the market fell right through this tramline and is heading for the second down-sloping tramline in the $1,575 area.
This should be decent support and could well lead to a bounce.
But if support here gives way, then my first major target is the $1,500 area (marked by pink bar in chart below):

(Click on the chart for a larger version)
The gently down-sloping tramline is one I showed in my 30 April email. That is very solid support and I could look to take at least partial profits here.
There could be a fierce breakout coming
OK, gold has been in a major consolidation zone since October. It's currently roughly half-way between the $1,800 highs and the $1,500 lows.
Because this is a very long period of consolidation, I expect the breakout to be fierce. But first, the market must approach the $1,500 area and that is only $90 away as I write. Interesting times for gold!
Because asset markets are trading more-or-less in synch from copper to crude oil to shares to the metals, it is always a good idea to see what is going on in these markets.
I regularly check on these markets for possible tips as to direction.
Yesterday, I covered the Dowand showed that my charts are forecasting big declines ahead. Since writing that, the Dow fell yesterday to my first target at 12,800.
My conclusion: No help for gold bulls from the Dow!
Is gold's bull market over?
Remember, gold is probably the most emotional market you can trade. It has no intrinsic value, except for the small amount used industrially. It offers no interest payments. And it costs money to store.
It is primarily a store of value and its worth is entirely established by the opinions of people who trade it. In times like these, many have bought it to protect against the falling value of paper' currencies. This is an entirely logical response.
But markets are not logical they are emotional! If you don't believe me, then try to forecast gold prices logically using only the fundamentals'; mine supply, central bank sales, Indian jewellery data, and so on. Can you do it?
One final point gold has been in a massive bull market for many years. Everyone and his dog knows this. But the time to get long was in the early years, when no-one was interested. Buy low, sell high, remember?
But trends change often for no apparent reason. If you are stuck in an ageing bullish mentality, you will probably deny this change and even buy more.
Traders do not do battle with the markets they fight themselves! That's something worth remembering and trying to overcome. Always be prepared to change your view, depending what the charts show you.
I'm dying to know what's your view on gold? Are you bullish or bearish and what do you see in these charts? Let me know your thoughts below.
If you're a new reader, or need a reminder about some of the methods I refer to in my trades, then do have a look at my introductory videos:
The essentials of tramline trading
An introduction to Elliott wave theory
Advanced trading with Elliott waves
Don't miss my next trading insight. To receive all my spread betting blog posts by email, as soon as I've written them, just sign up here .
Get the latest financial news, insights and expert analysis from our award-winning MoneyWeek team, to help you understand what really matters when it comes to your finances.
John is is a British-born lapsed PhD physicist, who previously worked for Nasa on the Mars exploration team. He is a former commodity trading advisor with the US Commodities Futures Trading Commission, and worked in a boutique futures house in California in the 1980s.
He was a partner in one of the first futures newsletter advisory services, based in Washington DC, specialising in pork bellies and currencies. John is primarily a chart-reading trader, having cut his trading teeth in the days before PCs.
As well as his work in the financial world, he has launched, run and sold several 'real' businesses producing 'real' products.
-
 ISA fund and trust picks for every type of investor – which could work for you?
Whether you’re an ISA investor seeking reliable returns, looking to add a bit more risk to your portfolio or are new to investing, MoneyWeek asked the experts for funds and investment trusts you could consider in 2026
-
 The most popular fund sectors of 2025 as investor outflows continue
It was another difficult year for fund inflows but there are signs that investors are returning to the financial markets