Don’t make this amateur trading mistake
Many traders want to be confirmed right in their view of the markets, says John C Burford. But that is not how a professional should think.
Get the latest financial news, insights and expert analysis from our award-winning MoneyWeek team, to help you understand what really matters when it comes to your finances.
You are now subscribed
Your newsletter sign-up was successful
Want to add more newsletters?

Twice daily
MoneyWeek
Get the latest financial news, insights and expert analysis from our award-winning MoneyWeek team, to help you understand what really matters when it comes to your finances.

Four times a week
Look After My Bills
Sign up to our free money-saving newsletter, filled with the latest news and expert advice to help you find the best tips and deals for managing your bills. Start saving today!
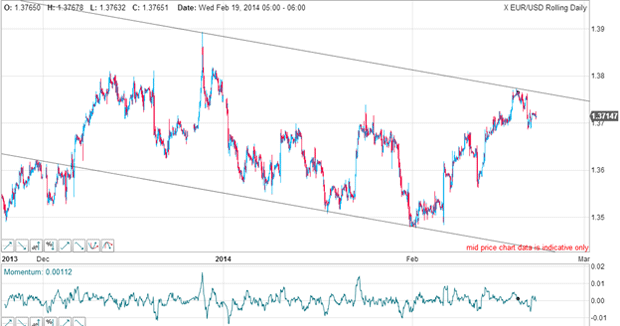
In my post of 21 February, I set up a case for an imminent decline in the euro and a rally in the US dollar. The EUR/USD had made a spike high near the 1.39 level on 27 December. And since then, it has been making a series of small-scale waves.
This was my new tramline pair I had working:

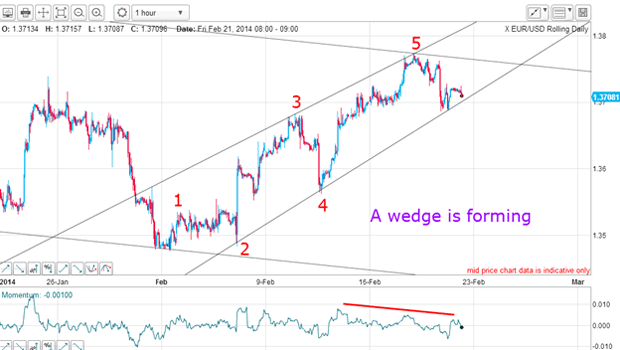
And the rally off the early February low was in the form of a wedge:
MoneyWeek
Subscribe to MoneyWeek today and get your first six magazine issues absolutely FREE

Sign up to Money Morning
Don't miss the latest investment and personal finances news, market analysis, plus money-saving tips with our free twice-daily newsletter
Don't miss the latest investment and personal finances news, market analysis, plus money-saving tips with our free twice-daily newsletter

With the negative-momentum divergence and the complete five-wave pattern up, the odds were high that there was nothing left in the tank. And that would mean a decline was probable.
The scenario that subsequently unfolded is a good example of what separates amateur and professional traders. Let me explain why.
Are the markets going up or down?
Let's see how that forecast has played out.
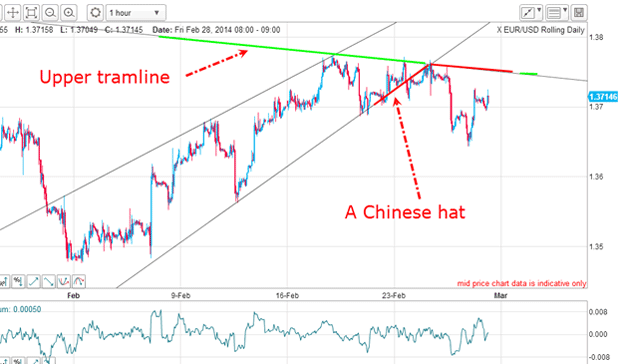
Since 21 February, the market did indeed break below my lower wedge line (several times). It also made a traditional kiss and declined in a scalded-cat bounce. So far, it was shaping up to be a textbook trade.
Note that the kiss occurred at the crossing of the wedge line with my lower tramline drawn off the 27 December high. This is what I call a Chinese hat. It's a region of extra-powerful resistance. When the market saw that resistance, it fell heavily.
The Chinese hat is an excellent place to position for a trade at low risk. Protective stops can be entered just above the hat, giving you that vital low-risk trade.
But the decline was halted yesterday from the 1.3650 level. That's where the market staged the rally that is currently in progress.
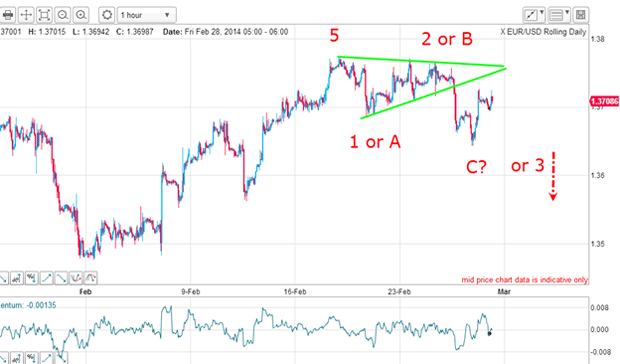
So far, the overall picture hasn't changed. My wave 5 high has not been exceeded, and that means I can make these Elliott wave labels:

There is a clear three waves down, and that always poses a dilemma for an Elliott wave (EW) interpretation. Is it an A-B-C, or the start of a five-wave pattern?
The implications are diametrically opposed. If it is an A-B-C, which is a corrective pattern, the market would go on to make new highs.
But if the pattern is the start of a five-wave impulsive pattern, the trend will be sharp down. That is why the rally from yesterday throws a spanner in the EW works.
How to tell the difference between an A-B-C correction and a five-wave impulsive down move
Since markets are fractals, we can look at the even smaller picture and try some EW labels:

From my red wave 2 high, I can start a smaller-scale EW count. Thursday's 1.3650 low is my new wave 1 (in purple) and yesterday's rally is my new wave 2, which may or may not be complete.
How can I tell if we have an A-B-C correction or a five-wave impulsive down move?
If the market declines from here, that would tend to validate the picture in the above chart.
But if the market rallies strongly from here, that would tend to cancel out this interpretation. And a rally above the 1.3760 highs would definitely negate it.
But having a short trade at the Chinese hat in the 1.3750 area gives me a cushion especially when using my break-even rule. That's because now the protective stop can be lowered to the trade entry price, giving a risk-free trade.
Professionals versus amateurs
So many traders want to be right in their view. They may have read all about eurozone economic woes and concluded the euro was doomed. This is not how a professional thinks! An amateur wants the market to conform to his/her view and will generally fight it when it goes the wrong' way.
A professional, on the other hand, has no strong view of what the market should' do. He/she lets the market decide what is right and tries to flow with the market.
Get the latest financial news, insights and expert analysis from our award-winning MoneyWeek team, to help you understand what really matters when it comes to your finances.
John is is a British-born lapsed PhD physicist, who previously worked for Nasa on the Mars exploration team. He is a former commodity trading advisor with the US Commodities Futures Trading Commission, and worked in a boutique futures house in California in the 1980s.
He was a partner in one of the first futures newsletter advisory services, based in Washington DC, specialising in pork bellies and currencies. John is primarily a chart-reading trader, having cut his trading teeth in the days before PCs.
As well as his work in the financial world, he has launched, run and sold several 'real' businesses producing 'real' products.
-
 Average UK house price reaches £300,000 for first time, Halifax says
While the average house price has topped £300k, regional disparities still remain, Halifax finds.
-
 Barings Emerging Europe trust bounces back from Russia woes
Barings Emerging Europe trust has added the Middle East and Africa to its mandate, delivering a strong recovery, says Max King