Has the euro topped in the charts?
The charts are presenting us with a very clear long-term picture, says John C Burford. Here's what that means for the euro.
Get the latest financial news, insights and expert analysis from our award-winning MoneyWeek team, to help you understand what really matters when it comes to your finances.
You are now subscribed
Your newsletter sign-up was successful
Want to add more newsletters?

Twice daily
MoneyWeek
Get the latest financial news, insights and expert analysis from our award-winning MoneyWeek team, to help you understand what really matters when it comes to your finances.

Four times a week
Look After My Bills
Sign up to our free money-saving newsletter, filled with the latest news and expert advice to help you find the best tips and deals for managing your bills. Start saving today!
When I last covered the euro, I noted that I was wrong in my short-term analysis. And I'm OK with that. Being wrong is a fact of life in trading. We are dealing with probabilities, not certainties. And we always have incomplete information which only comes to light later.
Successful trading is about losing as little as possible on your losers and making as much as possible on your winners. But when you do go wrong, it always helps to go back and see why it happened. That way, you can hopefully learn from your mistakes.
Where did I go wrong?
MoneyWeek
Subscribe to MoneyWeek today and get your first six magazine issues absolutely FREE

Sign up to Money Morning
Don't miss the latest investment and personal finances news, market analysis, plus money-saving tips with our free twice-daily newsletter
Don't miss the latest investment and personal finances news, market analysis, plus money-saving tips with our free twice-daily newsletter
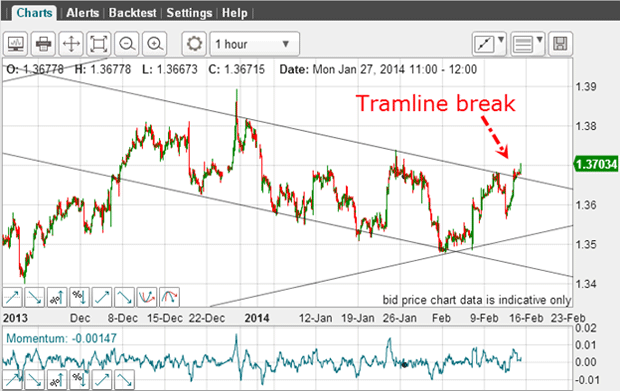
But these alternative tramlines only come to light after we have made our first attempt. Let me show you what I mean here is the chart I showed a week ago:

I started with the lower tramline because the lows appeared to lie on or close to a straight line. If I could fit those onto a line with only small over- and under-shoots, I should have a reliable line of support. And if I could also have a prior pivot point (PPP), that would make it even more secure.
With this line in place, the next step was to look for the upper tramline. I found three accurate highs right away, but I had to cut off the extreme spike high to the 1.39 level in the process. With this, I believed I had a great tramline pair.
The tramline break on 14 February then gave me a signal to go long EUR/USD at around the 1.3680 level.
The euro is about to resume its bear trend

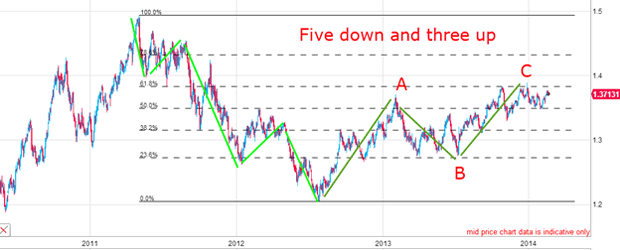
From the 1.50 high, the bear market down is in five clear impulsive waves to the July 2012 low at 1.20. Not only that, but the relief rally is in a clear A-B-C form and the C wave high has carried to the Fibonacci 62% retrace. This is straight out of the Elliott wave textbook, where relief rallies most often turn at this 62% level.
The big picture is very clear: the euro is about to resume its bear trend.
This puts the short-term long euro trade in doubt as a longer-term prospect.
Always be prepared to amend your tramlines

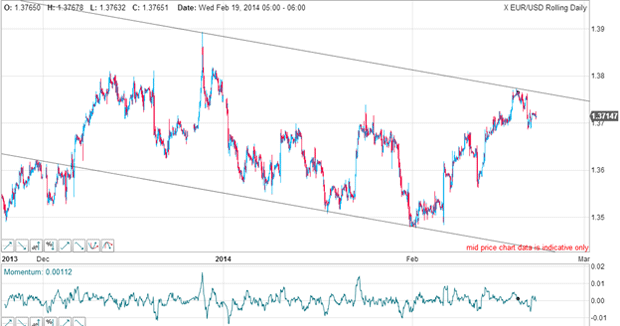
With seven days' trading action since my last post now available, I am able to draw in a new tramline pair. Now I have an even better PPP and two accurate touch points on my lower tramline.
But the interesting line is the upper tramline: it takes in the 1.39 spike high top! Now I do not have to cut off this spike high, as I did last time. The high on Wednesday is an accurate touch point which confirms the line as resistance.
This makes me much more comfortable with these tramlines. But I could only draw them given the trading action from the past week, which was obviously unavailable last time.
Remember, when using tramlines, you must be prepared to amend your lines in the light of current market action.
Are we about to see a decline?
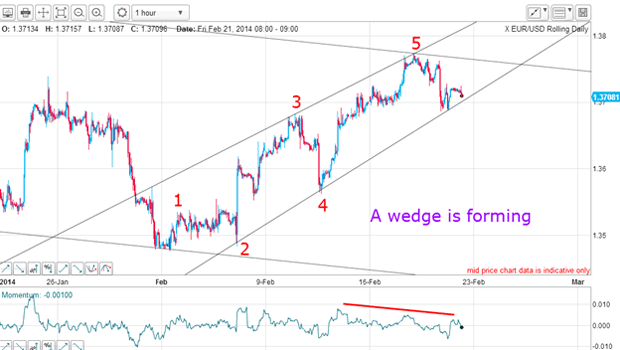
It's time to take a closer look because I see that the rally from early February has some interesting highs and lows that could be forming a useful pattern:

Sure enough, I can draw a potential wedge on this rally and I can label five clear Elliott waves to it. Wave 3 is not the longest wave, although it usually is. But so long as it is not the shortest, that is OK. Wave 5 is extended and has five clear sub-waves complete with a large negative-momentum divergence.
Remember, a fifth wave is an ending wave.
This is now painting a very different picture to that given by my original tramline break. That indicated a long trade at the 1.3680 level and could have resulted in a profit to the 1.3780 Wednesday high, or at least a break-even trade.
But the longer-term potential trade now is to the downside. If my wedge pattern is accurate, a break of it should herald a swift decline to at least the start of the wedge at the 1.35 area.
What the COT data tells us
| (Contracts of EUR 125,000) | Row 0 - Cell 1 | Row 0 - Cell 2 | Row 0 - Cell 3 | Open interest: 281,037 | ||||
| Commitments | ||||||||
| 75,048 | 81,977 | 7,684 | 157,239 | 131,888 | 239,971 | 221,549 | 41,066 | 59,488 |
| Changes from 02/04/14 (Change in open interest: 6,891) | ||||||||
| 7,434 | 753 | -1,289 | -3,497 | 12,107 | 2,648 | 11,571 | 4,243 | -4,680 |
| Percent of open in terest for each category of traders | ||||||||
| 26.7 | 29.2 | 2.7 | 55.9 | 46.9 | 85.4 | 78.8 | 14.6 | 21.2 |
| Number of traders in each category (Total traders: 183) | ||||||||
| 33 | 73 | 23 | 47 | 53 | 96 | 133 | Row 8 - Cell 7 | Row 8 - Cell 8 |
During the latest rally, both sets of specs (non-commercials and non-reportables) swung a very long way into the bullish camp (while the smart money commercials took the other side of those trades).
I am confident that there has been an even greater bullish swing since that data was published (the next data set is due out later today).
Trader attitudes towards the US dollar has been running bearish of late, as traders have wondered if the recent spate of disappointing US economic data would weaken the resolve of the Fed to continue tapering. It's now a real possibility that the Fed will not be stopping their printing presses after all.
So with the build-up of bullish positions, the scene is set for a potential swift decline and a big bull move in the dollar.
Get the latest financial news, insights and expert analysis from our award-winning MoneyWeek team, to help you understand what really matters when it comes to your finances.
John is is a British-born lapsed PhD physicist, who previously worked for Nasa on the Mars exploration team. He is a former commodity trading advisor with the US Commodities Futures Trading Commission, and worked in a boutique futures house in California in the 1980s.
He was a partner in one of the first futures newsletter advisory services, based in Washington DC, specialising in pork bellies and currencies. John is primarily a chart-reading trader, having cut his trading teeth in the days before PCs.
As well as his work in the financial world, he has launched, run and sold several 'real' businesses producing 'real' products.
-
 Average UK house price reaches £300,000 for first time, Halifax says
While the average house price has topped £300k, regional disparities still remain, Halifax finds.
-
 Barings Emerging Europe trust bounces back from Russia woes
Barings Emerging Europe trust has added the Middle East and Africa to its mandate, delivering a strong recovery, says Max King