A change of direction is imminent in the stockmarkets
There has been a deluge of warnings of an imminent stockmarket crash in the media. John C Burford looks for evidence in the charts.
Get the latest financial news, insights and expert analysis from our award-winning MoneyWeek team, to help you understand what really matters when it comes to your finances.
You are now subscribed
Your newsletter sign-up was successful
Want to add more newsletters?

Twice daily
MoneyWeek
Get the latest financial news, insights and expert analysis from our award-winning MoneyWeek team, to help you understand what really matters when it comes to your finances.

Four times a week
Look After My Bills
Sign up to our free money-saving newsletter, filled with the latest news and expert advice to help you find the best tips and deals for managing your bills. Start saving today!
Now that every man, woman, child and their dogs (and cats) are bullish stocks and believe they can never fall courtesy of the Fed and that we are about to enter the sunny uplands of 2015, my mind is turning to thoughts of a historic reversal. One that will shock most people in its severity.
But such thoughts are very much tempered at present by the recent deluge of warnings in the media that stocks are about to crash. This is not the usual scenario, of course. Tops are usually made when the media are overwhelmingly bullish.
But if enough believe a crash is imminent, the selling will probably induce that result anyway.
MoneyWeek
Subscribe to MoneyWeek today and get your first six magazine issues absolutely FREE

Sign up to Money Morning
Don't miss the latest investment and personal finances news, market analysis, plus money-saving tips with our free twice-daily newsletter
Don't miss the latest investment and personal finances news, market analysis, plus money-saving tips with our free twice-daily newsletter
Remember, prominent stock bears are an extinct species and will not provide the buying necessary to moderate sharp falls.
But the charts are shaping up to indicate a change of trend of some kind is imminent, if it hasn't already tipped its hand.
So today, I will review the latest evidence to see if it points to major tops that are forming.
The FTSE displays two impressive wedges
the state of the stock markets
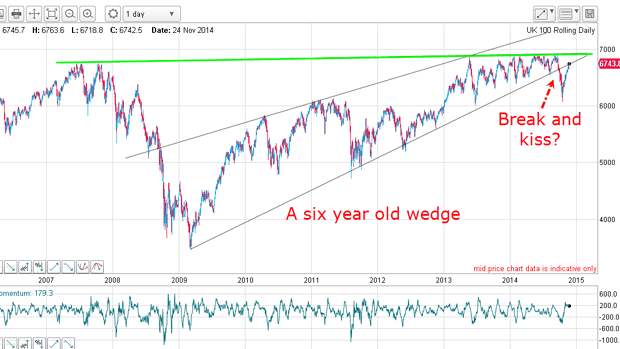
What is impressive here are the two wedges. Both have the same lower wedge line and that has been a very powerful line of support for six years. The green upper line wedge is also long in the tooth at seven and a half years.
Note that the rallies have been stopped dead in their tracks at this green line. It is a very powerful line of resistance.
As the market spring coiled ever tighter towards the apex in October, something had to give. And that something was the huge swoon in October. That relieved the pressure off the spring for a while and allowed the market to continue its rally.
But when it kissed the lower line, that was the moment of truth. Either the market would move back down in a scalded-cat bounce, or it would thrust up and punch above the green resistance line. You can be sure if it did that, the rallies would be vigorous because that is an area where many buy-stops have been accumulated.
As it happened, the market is bouncing down off the line as I write. Here is a close-up:
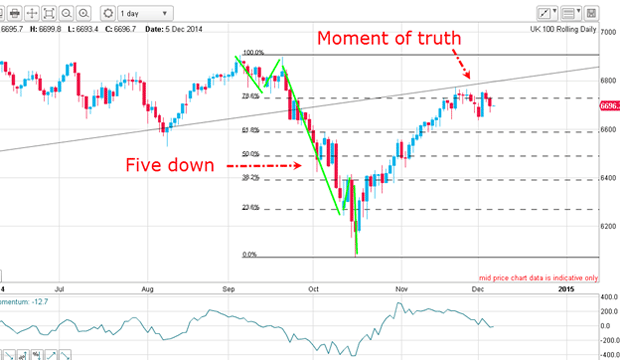
The October swoon has a clear motive five-wave form, indicating a likely change of trend. And it appears that a scalded-cat bounce is in progress off the kiss. So far, so good.
Let me now review a few more indexes.
S&P 500 Will there be a sharp move down?
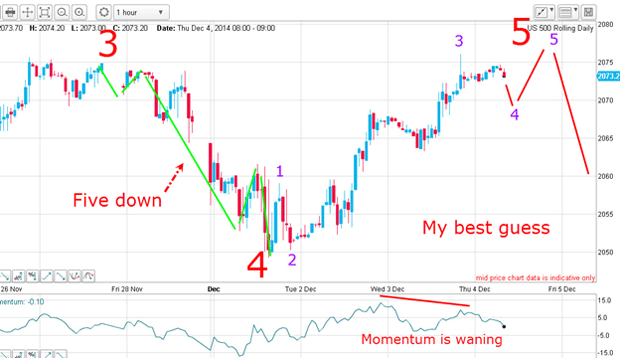
This was the picture yesterday morning. I projected a dip in w4 yesterday and a rally to a new high in w5. You can check yourself if this projection was correct.
If this is the correct Elliott wave picture, the next move is likely to be sharp down.
German DAX is this a key reversal?
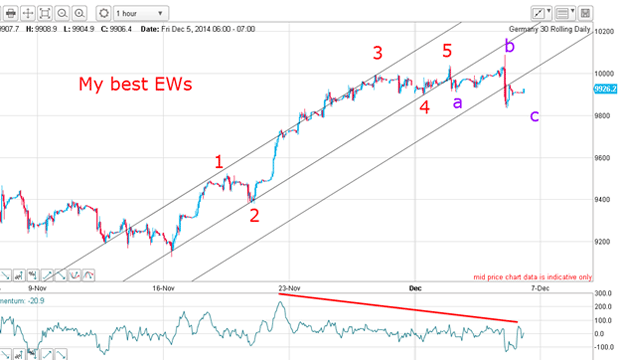
This is the hourly and I have excellent tramlines and Elliott-wave labels. Note the b wave failed to kiss the centre tramline a sure sign the rally was running out of steam.
Now the market has broken my lowest tramline and is rallying to try to kiss that tramline. Here is a close-up:
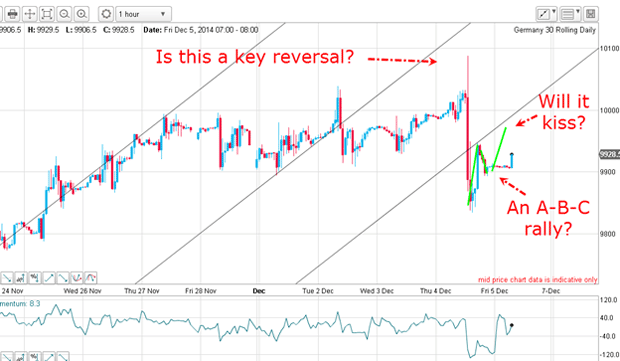
The interesting feature of this chart is the possible daily key reversal yesterday (new high and lower close).
(As an exercise, why not open the daily DAX chart and count how many highs have been made on key reversals (red candles)?)
This morning, the market is rallying and if it plants a kiss, that would make an A-B-C pattern and provide another piece of evidence a top is in.
Russell 2000 A reversal could happen at any moment
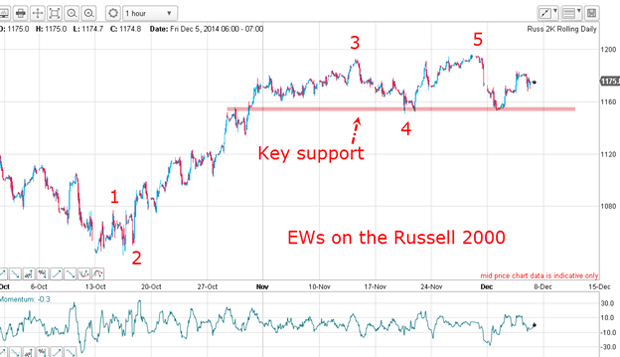
This is my best guess for the Elliott-wave labels (there is an equally valid alternative which calls for a new high). Note the key support level a break of that would place the odds very high that the reversal had occurred. That level bears watching very closely.
Here is a close-up:
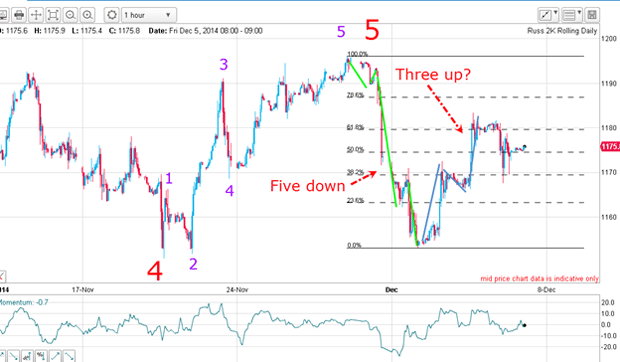
I have five up from the w4 low to w5 high, and the market is making an A-B-C rally to the Fibonacci 62% level. This is textbook and confirmation for the reversal would be provided if the market falls from near current levels.
The best way to bet
Historically, major tops in stock indexes are complex affairs with many dips and rallies before a clear trend becomes apparent. I do not expect a different pattern this time.
But remember, all of this analysis can come to nought if the market decides to carry on with its massive rally. We are dealing in probabilities at all times. Even 100-to-one outsiders can win races against the five-to-four favourites! But as Damon Runyon said: "but that is the way to bet".
Get the latest financial news, insights and expert analysis from our award-winning MoneyWeek team, to help you understand what really matters when it comes to your finances.
John is is a British-born lapsed PhD physicist, who previously worked for Nasa on the Mars exploration team. He is a former commodity trading advisor with the US Commodities Futures Trading Commission, and worked in a boutique futures house in California in the 1980s.
He was a partner in one of the first futures newsletter advisory services, based in Washington DC, specialising in pork bellies and currencies. John is primarily a chart-reading trader, having cut his trading teeth in the days before PCs.
As well as his work in the financial world, he has launched, run and sold several 'real' businesses producing 'real' products.
-
 MoneyWeek Talks: The funds to choose in 2026
Podcast Fidelity's Tom Stevenson reveals his top three funds for 2026 for your ISA or self-invested personal pension
-
 Three companies with deep economic moats to buy now
Opinion An economic moat can underpin a company's future returns. Here, Imran Sattar, portfolio manager at Edinburgh Investment Trust, selects three stocks to buy now