The state of the stockmarkets, part 1
Many stockmarkets are flirting with all-time highs – so is major turn near? John C Burford looks at what the charts are saying.
Get the latest financial news, insights and expert analysis from our award-winning MoneyWeek team, to help you understand what really matters when it comes to your finances.
You are now subscribed
Your newsletter sign-up was successful
Want to add more newsletters?

Twice daily
MoneyWeek
Get the latest financial news, insights and expert analysis from our award-winning MoneyWeek team, to help you understand what really matters when it comes to your finances.

Four times a week
Look After My Bills
Sign up to our free money-saving newsletter, filled with the latest news and expert advice to help you find the best tips and deals for managing your bills. Start saving today!
Today, I will veer a little off-piste and offer part one of my assessment of the state of stockmarkets. I will publish part two next week.
Many indexes are flirting with all-time highs especially the major US markets. I have a sense that the major turn I have long been awaiting is near.
There is no doubt in my mind that the gigantic rallies since the lows of 2009 have been fuelled by the unprecedented degree of stimulus provided by central banks in the form of QE (quantitative easing) and Zirp (zero interest-rate policy). The cost-free funds thus created have flowed into assets and not the productive real world economy, which has experienced only modest growth.
MoneyWeek
Subscribe to MoneyWeek today and get your first six magazine issues absolutely FREE

Sign up to Money Morning
Don't miss the latest investment and personal finances news, market analysis, plus money-saving tips with our free twice-daily newsletter
Don't miss the latest investment and personal finances news, market analysis, plus money-saving tips with our free twice-daily newsletter
Also, it has been noted that much of the appreciation in shares has been the result of share buy-backs where cash-rich companies buy their own shares instead of investing for productive use, thus increasing their P/E valuesat a stroke without doing the more difficult work of growing their sales and earnings.
But what most pundits miss is this: it was the improving social mood from the utter depths of despair in 2009 that allowed the central banks to instigate these policies. Not only that, but it was the markets that dictated low interest rates. Inflation rates were falling, as were inflation expectations. That factor is the main driver of interest rates.
From one sentiment extreme to the other
This is what the effect of improving social mood has produced:
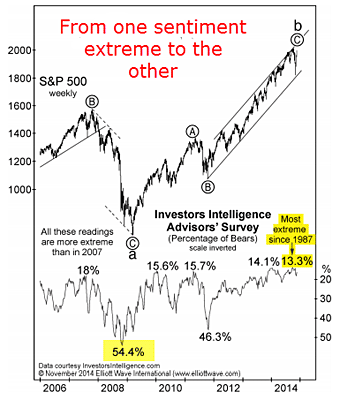
Chart courtesy www.elliottwave.com
This is the S&P 500 index plotted against the II sentiment surveyof professional advisers. Today, the percentage of bears is at a record low amazingly, even lower than at the major high in 2007 before the credit crunch collapse. At the 2009 lows and into 2010, the bears rapidly switched sides to the bulls' camp which produced the vigorous rally.
With a record level of professional bullishness today, have all of those who want to buy shares already done so? Is there anyone left to buy? If not, then maybe Rosetta will return to earth with some wealthy aliens from the comet and convince them to open investment accounts.
There is one more group although with much less buying power and that is the retail investor. Here is the latest AAII sentiment data:
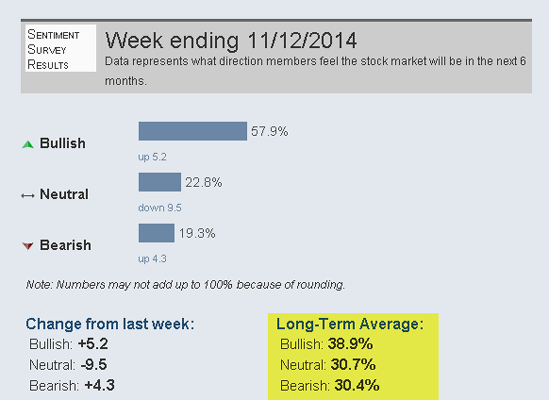
This suddenly lopsided bullish view of the public after years of fence-sitting shows that Joe and Jane Public are now in to stocks with all four feet. They have finally decided it is safe to invest with the Dow at the all-time high at 17,700.
Has the stampede for junk bonds reached its zenith?
Today, many economies are heading for deflation and some are already in and this is entirely consistent with low market rates. Of course, these zero rates offered by the Fed are only available to banks. In the real world, rates remain well above inflation.
But the side effect of Zirp was that it encouraged a hugely speculative hunt for yield, as well encouraging all sorts of asset bubbles (real estate, stamps, vintage cars, art, and so on).
Junk bonds are interesting because they are issued by the flakiest companies with the weakest prospects. Recently, junk bond yields have plunged to the 6% area (long term average is around 10%) as investors/gamblers judge the prospects of default virtually nil.
One other point: junk bonds along with small-cap shares are the most sensitive to changes in sentiment, otherwise known as risk-on or risk-off' behaviour.
But has the stampede for junk reached its zenith? Here is a recent story about one US issue promising to pay out at over 18%:
"Investors, seeking a higher return when interest rates are low, recently flocked to buy a bond issue from Prestige Financial Services of Utah. Orders to invest in the $390 million debt deal were four times greater than the amount of available securities.
"What is backing many of these securities? Auto [car] loans made to people who have been in bankruptcy." (My emphasis).
In the cold light of day, would you invest/gamble in such a bond? Even if it could survive for six years (which is doubtful), your interest payments would only pay back your initial investment. If a deal looks too good to be true
Are we heading for a stockmarket crash?
Problems on the general junk bond front are also starting to loom. Here is a chart of a major junk bond index, and it is not a pretty picture (for the bulls):
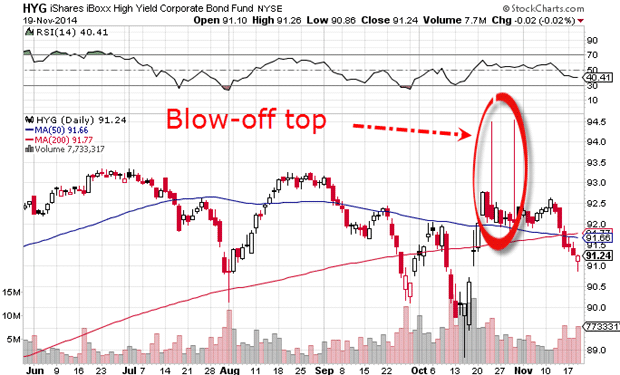
The market made two spikes into new high ground (lows in yield) last month and fell back. Now with the market in decline (rising yields), the blue line (50-day moving average) which is falling, has crossed beneath the red line (200-day moving average). This is a very bearish signal because it points to a rapid move from risk-on to risk-off.
I call this indicator my plunge-ometer'.
So, with virtually no bears in sight, if selling becomes intense, the tsunami should be historic as panicked investors/gamblers head for the exits all at the same time.
But do you know what? If this scenario pans out, the economic data will still come through and be seen to be good. Most will be stunned by the market action. That is what happens at market tops.
What the charts are telling us
Here is one index of small-cap shares (high risk), the Russell 2000:
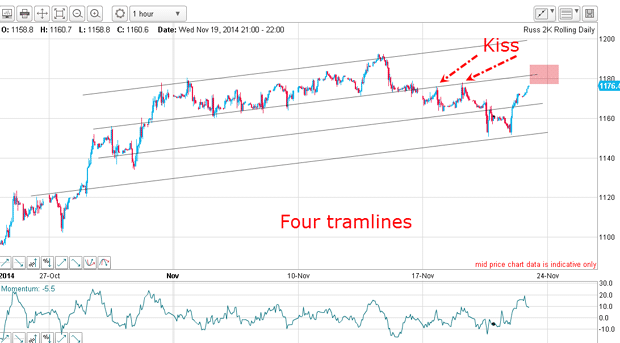
The Russell actually made its high back in March, but this is the latest action, showing my lovely tramlines.The second tramline has been kissed twice on the way down, but yesterday the market bounced off the lowest tramline and is challenging the kissing zone again.
And here is the daily Dow - just admire the persistence of the rally:
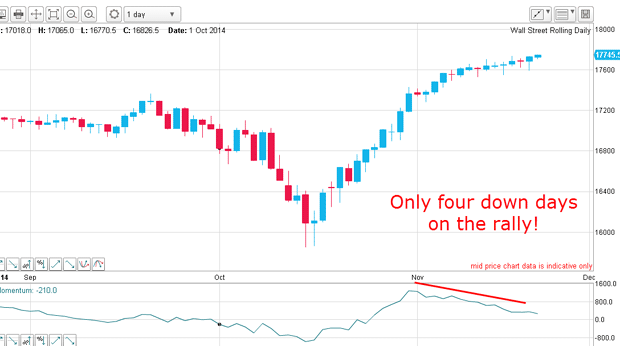
From the October low, there have been only four down days (red) in the 27-day period! And three of these red bars are tiny. To me, something smells fishy. In an honest market you see lots of two-way action, but not here.
Could there be a major buyer of last resort desperate to keep the plates in the air?
I shall develop this theme in part two next week.
Get the latest financial news, insights and expert analysis from our award-winning MoneyWeek team, to help you understand what really matters when it comes to your finances.
John is is a British-born lapsed PhD physicist, who previously worked for Nasa on the Mars exploration team. He is a former commodity trading advisor with the US Commodities Futures Trading Commission, and worked in a boutique futures house in California in the 1980s.
He was a partner in one of the first futures newsletter advisory services, based in Washington DC, specialising in pork bellies and currencies. John is primarily a chart-reading trader, having cut his trading teeth in the days before PCs.
As well as his work in the financial world, he has launched, run and sold several 'real' businesses producing 'real' products.
-
 ISA fund and trust picks for every type of investor – which could work for you?
Whether you’re an ISA investor seeking reliable returns, looking to add a bit more risk to your portfolio or are new to investing, MoneyWeek asked the experts for funds and investment trusts you could consider in 2026
-
 The most popular fund sectors of 2025 as investor outflows continue
It was another difficult year for fund inflows but there are signs that investors are returning to the financial markets