Another beautiful tramline setup in the euro
The action in the euro is a textbook case of how to use tramlines to take serious money out of the markets, says John C Burford.
Get the latest financial news, insights and expert analysis from our award-winning MoneyWeek team, to help you understand what really matters when it comes to your finances.
You are now subscribed
Your newsletter sign-up was successful
Want to add more newsletters?

Twice daily
MoneyWeek
Get the latest financial news, insights and expert analysis from our award-winning MoneyWeek team, to help you understand what really matters when it comes to your finances.

Four times a week
Look After My Bills
Sign up to our free money-saving newsletter, filled with the latest news and expert advice to help you find the best tips and deals for managing your bills. Start saving today!
As I said thelast time I covered the EUR/USD, all hell is breaking loose on the charts!
And I'm able to follow the moves using my tramline technique almost to the tick.
Today I'll show you why I love trading the euro. The action is a textbook case in how to use tramlines to your advantage and take serious money out of the markets.
MoneyWeek
Subscribe to MoneyWeek today and get your first six magazine issues absolutely FREE

Sign up to Money Morning
Don't miss the latest investment and personal finances news, market analysis, plus money-saving tips with our free twice-daily newsletter
Don't miss the latest investment and personal finances news, market analysis, plus money-saving tips with our free twice-daily newsletter
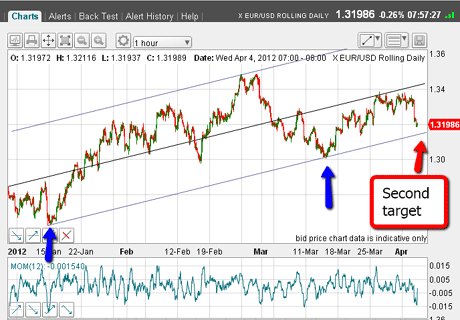
OK, on 4 April, I showed you a chart where I had placed my first price target, which had been hit.
The market was heading down towards the lower tramline in the 1.3150 area (my second target). Here's the chart I showed:

(Click on the chart for a larger version)
As I expected, again that target was hit. So what to do?
One of the most common questions I get is: Should I take profits when a target is hit? I know it's a dilemma that affects all of us me included.
Now, a trader has two options here. If trading short-term, one could take a quick profit on the short trade. If not, then another option would be to hold and move the stop to break-even.
It will really come down to your individual style or how you feel about the trade at the time.
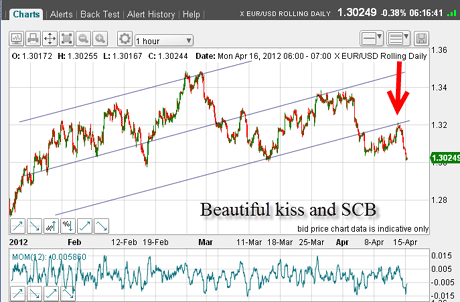
My lower tramline is now acting as resistance
OK, now my second target has been hit, what happened after that? As you can see, the market ploughed straight down below 1.31 and then bounced off chart support:

(Click on the chart for a larger version)
As I expected, the rally was weak and only took it to yes, the underside of the tramline (red arrow) in a beautiful kiss. Hollywood will definitely want this!
And after the kiss, the 'scalded cat bounce' (SCB) down, and this morning as I write, the market is on the verge of breaking chart support around the big round number 1.30.
This is why I love trading the EUR/USD I get a lot of accurate tramlines, loads of kisses and SCBs. I get good Fibonaccis and momentum divergences. What more could I ask?
Incidentally, on the hourly euro chart, I am seeing many tramline kisses and SCBs. On the chart above, just admire the lovely extended kiss on the previous break away from the centre tramline in late March/early April.
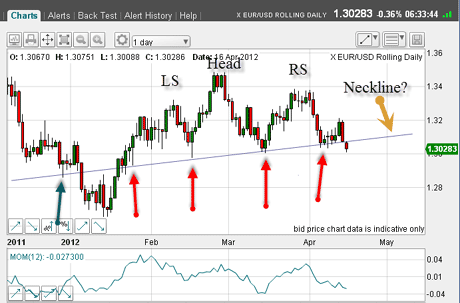
But back to today, and it's time to look at the bigger picture on the daily chart:

(Click on the chart for a larger version)
Here, I will be looking for more tramlines, but what strikes me right away is the support line, which I drew in easily.
We have a nice 'prior pivot point' (PPP) marked by the green arrow on the left. If you have studied my tramline video tutorial, you will know how much importance I place on these particular touch points
And then we have the solid touch points marked by the red arrows. All together, what I have is a very solid support line which, if broken, will be very hard to breach on the upside.
Head and shoulders pattern confirms my bearish view
But take a closer look at the form of the rally off the January lows. I believe I can see a potential 'head and shoulders'formation with my support line acting as the neckline.
Head and shoulders formations are good because they give us so much information about likely targets. As I write, the market is breaking below the neckline, helping to confirm my view.
The head and shoulders target I referred to is this: I draw in a tramline across the head (top) and parallel to my tramline on the chart above. Then I add another one equidistant below. The target lies on this lower line in the 1.27 area. It's not going to get there overnight but it's one to watch.
And interestingly, if you study the daily chart of the EUR/USD back to the July 2008 top at 1.60, you can see that we are in third Elliott waves of at least three degrees of trend measured off that top. Why not have a go at confirming this yourself?
If I'm correct, this is a most powerful set-up and fully supports my longer-term 1.20 target, which should be weeks/months away.
The ride should be exciting over the coming days and I'll be following the action here. Stay tuned!
If you're a new reader, or need a reminder about some of the methods I refer to in my trades, then do have a look at my introductory videos:
The essentials of tramline trading
An introduction to Elliott wave theory
Advanced trading with Elliott waves
Don't miss my next trading insight. To receive all my spread betting blog posts by email, as soon as I've written them, just sign up here .
Get the latest financial news, insights and expert analysis from our award-winning MoneyWeek team, to help you understand what really matters when it comes to your finances.
John is is a British-born lapsed PhD physicist, who previously worked for Nasa on the Mars exploration team. He is a former commodity trading advisor with the US Commodities Futures Trading Commission, and worked in a boutique futures house in California in the 1980s.
He was a partner in one of the first futures newsletter advisory services, based in Washington DC, specialising in pork bellies and currencies. John is primarily a chart-reading trader, having cut his trading teeth in the days before PCs.
As well as his work in the financial world, he has launched, run and sold several 'real' businesses producing 'real' products.
-
 MoneyWeek news quiz: Can you get smart meter compensation?
Smart meter compensation rules, Premium Bonds winners, and the Bank of England’s latest base rate decision all made the news this week. How closely were you following it?
-
 Adventures in Saudi Arabia
Travel The kingdom of Saudi Arabia in the Middle East is rich in undiscovered natural beauty. Get there before everybody else does, says Merryn Somerset Webb