Look at this classic tramline trade in the euro
The euro has crashed through a critical trendline in the market. But now it's up against a significant line of support. Can it keep going? John C Burford looks to the charts to find out.
Get the latest financial news, insights and expert analysis from our award-winning MoneyWeek team, to help you understand what really matters when it comes to your finances.
You are now subscribed
Your newsletter sign-up was successful
Want to add more newsletters?

Twice daily
MoneyWeek
Get the latest financial news, insights and expert analysis from our award-winning MoneyWeek team, to help you understand what really matters when it comes to your finances.

Four times a week
Look After My Bills
Sign up to our free money-saving newsletter, filled with the latest news and expert advice to help you find the best tips and deals for managing your bills. Start saving today!
Today we're getting back to one of my favourite markets, the euro, where all Hell's broken loose on the charts!
First, a quick heads-up on the week ahead. This will be my lastpost before the Easter break and will resumeon Tuesday, and then Wednesday and Friday as usual.
Before I tell you about my latest lovely euro trade, I'd just like to follow up on my coverage on Monday on Barclays. It's the kind of individual stock readers are likely to follow and it trades nicely for my methods.
MoneyWeek
Subscribe to MoneyWeek today and get your first six magazine issues absolutely FREE

Sign up to Money Morning
Don't miss the latest investment and personal finances news, market analysis, plus money-saving tips with our free twice-daily newsletter
Don't miss the latest investment and personal finances news, market analysis, plus money-saving tips with our free twice-daily newsletter
The bearish pattern on Barclays' charts continues
Recall that on Monday, I was looking for a major top at 260p in the rally off the 133p low of last September. I had ticked many of my boxes that identified 260p as a genuine contender for the top.
I also noted that trading in March had been confined to a narrow range and that a significant closing break of the lower bound would solidify my case.
Trader tip: If you're new to trading, inter-day breaks of support lines do occur. But sometimes the break is what I call a head fake' as the markets come back into the trading zone before the close. A much more convincing break occurs when the daily closing price stays underneath the support line.
Late on Monday, the market did break my support line at the 235p area, but rallied back to close above it. That was close, but no cigar.
But yesterday, I got that close beneath the line that I was waiting for.
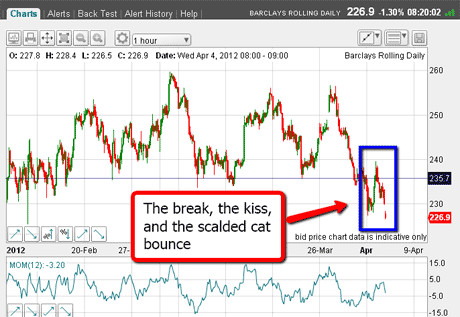
Now take a look at today's chart, which shows additional weakness on the opening:

(Click on the chart for a larger version)
Yesterday's action shows the classic support break, then the kiss back to the underside (with slight overshoot), and now the scalded cat bounce'.
This is textbook stuff. The odds are now very much on my side for a substantial decline. Let's see how it unfolds.
Trader tip: I often see this behaviour where a trendline or support is broken, then a pull-back to the line, and then a rapid move away (I call this the 'scalded cat bounce' in honour of the well-known 'dead cat bounce effect'). These pull-backs can allow for a late entry in case I missed an earlier one.
Tramline break signals a new short on the euro
Right, back to today and it's time to look at EUR/USD, one of my favourite markets.
I last covered the euro on 19 March and a lot has occurred since then!
Recall, I had taken almost 400 pips off a short trade and was then long on a counter-trend rally, with my protective stop moved to break even.
As it happened, the rally extended to the Fibonacci 76% retrace, where I decided to take profits. That's because the market had also reached the major downtrend line off the August and October highs.
Since then, the market has been trading in a congestion zone with no clear direction. I was glad to be on the sidelines just watching and waiting.
And I did not have to wait very long for a clear signal!
Up until yesterday, I felt the market had the potential to move above the major downtrend line. And in fact, on my tramline placements, the market did poke a little above it.
I was tempted to try a long trade here, but I decided to hold fire as I suspected that crucial economic reports due out this week could shake the market up.
And sure enough, yesterday afternoon, the market was shaken and a critical tramline was broken. That was my signal to short.
Take a look at the chart to see what happened:

(Click on the chart for a larger version)
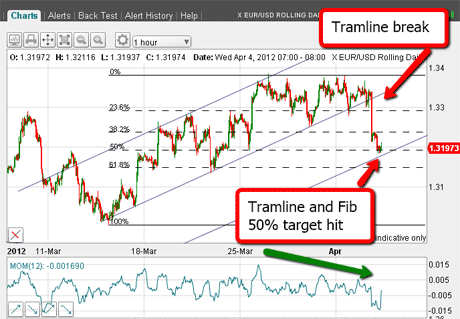
As you can see, I've drawn in a wonderful tramline trio. First I drew the centre line, which was easy to identify from all the minor lows. Then I added the other tramlines.
I like the upper one as it passes right across the rally highs. Note also the weakening momentum (green arrow) as the rally struggled along the centre tramline. This was a sign that a break was imminent.
And that break occurred at 3.00pm where I placed my short trade with a protective stop at the 1.3370 area.
Right away, I could identify my first target the lower tramline in the 1.3180 area. That is where short-term traders could be taking profits for a nice 120-pip profit, or £120 per £1 spread bet.
This is also the region of the Fibonacci 50% retrace of the rally yet another reason to suspect a bounce.
I can now use my tramlines to map out two more targets
OK, that is the short-term view. Let's back up to a longer-term look:

(Click on the chart for a larger version)
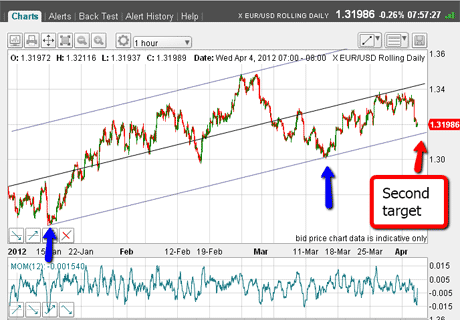
I have drawn in the trendline off the January and March major lows (the blue arrows). My second target is on this line in the 1.3150 area just under my first target.
Incidentally, how do you like my new tramlines? This is another set of three which illustrates that you can identify more than one set on any chart.
And let's back up even further. Here is the daily chart:

(Click on the chart for a larger version)
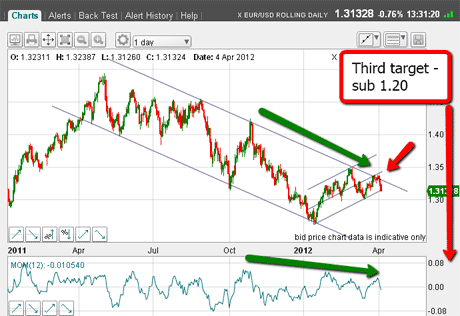
The recent rally to the 1.3350 area took it right to the major upper tramline (red arrow) with a slight overshoot a head fake, in fact!
Note the weakening momentum on each of the highs (green arrow). If the decline continues, my third target is the 1.30 area, where significant chart support resides.
If this can be breached, it should be chocks away for the major target at the lower tramline (off the chart) in the sub-1.20 region.
Now that would make a euro bear's day! But that would be months away, most likely. I'll be following it closely in theseposts so make sure you don't miss an issue to see how I get on and what you can learn from my trades.
Of course, as you can see from the daily chart, there are treacherous peaks and valleys. That is exactly why I trade the swings rather than try for long-term trades.
In fact, a trader could allot a small part of hiscapital to long-term positions using wide stops. They could set an exit order very far from the market. So long as the stop is not hit, they could put these in the drawer and virtually forget about them until the exit order is filled probably months hence and they would then have a nice surprise. Some traders have a separate account for these trades.
If you're a new reader, or need a reminder about some of the methods I refer to in my trades, then do have a look at my introductory videos:
The essentials of tramline trading
An introduction to Elliott wave theory
Advanced trading with Elliott waves
Don't miss my next trading insight. To receive all my spread betting blog posts by email, as soon as I've written them, just sign up here .
Get the latest financial news, insights and expert analysis from our award-winning MoneyWeek team, to help you understand what really matters when it comes to your finances.
John is is a British-born lapsed PhD physicist, who previously worked for Nasa on the Mars exploration team. He is a former commodity trading advisor with the US Commodities Futures Trading Commission, and worked in a boutique futures house in California in the 1980s.
He was a partner in one of the first futures newsletter advisory services, based in Washington DC, specialising in pork bellies and currencies. John is primarily a chart-reading trader, having cut his trading teeth in the days before PCs.
As well as his work in the financial world, he has launched, run and sold several 'real' businesses producing 'real' products.
-
 Average UK house price reaches £300,000 for first time, Halifax says
While the average house price has topped £300k, regional disparities still remain, Halifax finds.
-
 Barings Emerging Europe trust bounces back from Russia woes
Barings Emerging Europe trust has added the Middle East and Africa to its mandate, delivering a strong recovery, says Max King