The stock that obeys my trading rules
Stocks don't often play ball when it comes to following John C Burford's trading methods. But every once in a while, one falls into line - and this one's a cracker.
Get the latest financial news, insights and expert analysis from our award-winning MoneyWeek team, to help you understand what really matters when it comes to your finances.
You are now subscribed
Your newsletter sign-up was successful
Want to add more newsletters?

Twice daily
MoneyWeek
Get the latest financial news, insights and expert analysis from our award-winning MoneyWeek team, to help you understand what really matters when it comes to your finances.

Four times a week
Look After My Bills
Sign up to our free money-saving newsletter, filled with the latest news and expert advice to help you find the best tips and deals for managing your bills. Start saving today!
Most of the time, I trade three markets: the Dow, euro and gold. These are the markets that work best for my style of trading.
But I can still apply my methods to other markets with some success. I showed you that last week with my FTSE trade.
As for individual shares, generally I avoid them. That's because most of them just do not play ball with my methods. Besides, I have enough on my plate with my chosen markets!
MoneyWeek
Subscribe to MoneyWeek today and get your first six magazine issues absolutely FREE

Sign up to Money Morning
Don't miss the latest investment and personal finances news, market analysis, plus money-saving tips with our free twice-daily newsletter
Don't miss the latest investment and personal finances news, market analysis, plus money-saving tips with our free twice-daily newsletter
But there are exceptions. Every now and then, I'll spot an opportunity to trade an individual share.
Barclays is one example as I'll show you today.
It's a major international bank, it is very widely held, it has a very high number of shares outstanding and it has a long history. In fact, it's my bellwether for the UK financial services industry, which contributes around 10% to the UK GDP.
And as you'll see, it can behave in a way that suits my trading methods perfectly.
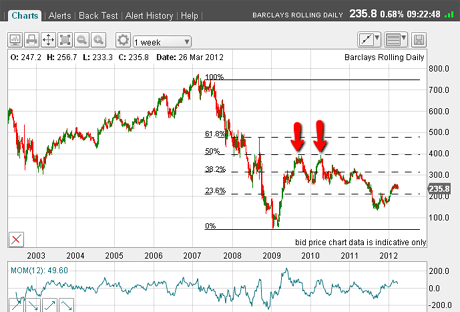
Let's start with some background. Here's the weekly chart for Barclays going back some ten years:
(Click on the chart for a larger version)
What this chart shows is the end of the huge multi-decade credit-pumped bull market in 2007. This culminated in the 770p high for Barclays in February.
An interesting aside is that Barclays topped out four or five months before the main FTSE index topped. It was the explosion in credit (and debt) that helped propel the large bull markets since WWII and brought about a hugely inflationary economy. So it was telling that the Barclays top in February foretold the coming collapse in the economy, and the FTSE. Credit availability collapsed, as did demand.
Barclays' chart shows the collapse of the credit bubble
Markets respond to the up and down waves of liquidity, following the waves of public attitude to credit.
And because banks' profits depend crucially on evermore credit availability, the Barclays price collapsed from the 770p high to the bear market low of 47p in January 2009.
That was a loss of 94% in two years, and conforms to the general rule that when bubbles collapse, they lose 90% or more of their peak value.
Trader tip: For bubble-watchers Apple Inc? a rule of thumb is that when they burst, they decline by 90% or more from their peak. Sometimes, it takes a while, but usually the decline is a lot more rapid than the ascent.
Isn't that a staggering performance? Prior to 2007, British banks were the traditional safe haven for widows and orphans', pension funds, and the like.Not anymore.
But let's get back to the charts. They're about to get even more interesting.
In the weekly chart I showed you above, from the 47p plunge low, the market has recovered right to the Fibonacci 50% retrace and then backed off.
It seems the chart is obeying Fibonacci principles. The question is: will it continue, and can I spot any tramlines and Elliott waves? If so, this is a market that I could trade.
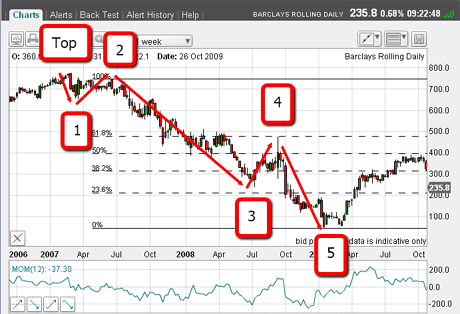
Let's take a look. Here is the chart showing the decline off the Fibonacci 50% top:
(Click on the chart for a larger version)
Well, as you can see, I can count a very nicely-proportioned five Elliott waves down from the top. This includes a long and strong' third wave which reached very low momentum readings prior to the wave 5 low at 47p.
Having completed five waves, the market was now ready for a large counter-trend bounce and it duly arrived.
Trader tip: This is one of the most valuable aspects of Elliott wave theory that I use. When I can identify five waves clearly, I can take profits near the fifth wave ending and look for an A-B-C counter-trend move and even look to take an opposite trade on occasion.
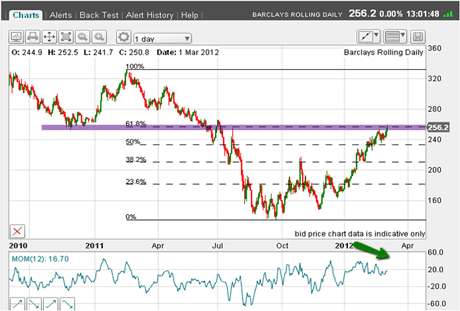
So how far will this rally go? Here is a terrific chart:
(Click on the chart for a larger version)
It shows the A-B-C rally off the 47p low to the precise Fibonacci 62% retrace at 260p. The purple bar shows the chart resistance from the December 2010 lows. This is formidable resistance.
Also note the weakening momentum (shown by the green arrow) as the rally progressed. But this is not all!
Using the tramlines to find an entry point
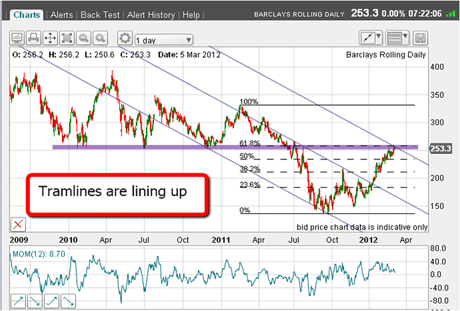
Here is a close-up chart:
(Click on the chart for a larger version)
I have drawn in three good tramlines and the rally to 260p has taken it to the upper tramline. This is additional resistance.
At this point, the evidence was piling up for me to make a confident short sale at 260p.
Now let's look at an even closer-range chart:
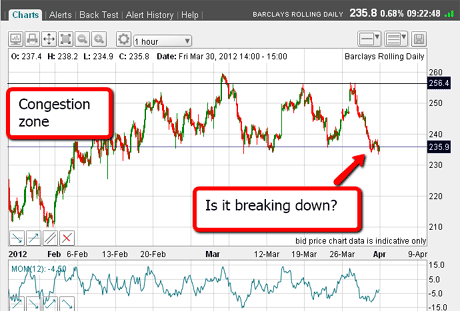
(Click on the chart for a larger version)
This is the hourly chart. See how since the market made its 260p high on 2 March, it has been trading in a consolidation or congestion zone, but is currently testing its critical lower bound.
A good close beneath this line would confirm the top at 260p is in.
After all, we have all the necessary ingredients a complete A-B-C counter-trend rally, a solid Fibonacci retrace, and a general FTSE market that shows the hallmarks of turning itself around into a bear market move (see mypost of 28 March).
Of course, there are no guarantees. Barclays could rally above 260p towards the next Fibonacci retrace (76%) at the 290p level.
But my short entry at 260p gives me some breathing room and gives me a shot at having picked the top of a nice swing.
If you're a new reader, or need a reminder about some of the methods I refer to in my trades, then do have a look at my introductory videos:
The essentials of tramline trading
An introduction to Elliott wave theory
Advanced trading with Elliott waves
Don't miss my next trading insight. To receive all my spread betting blog posts by email, as soon as I've written them, just sign up here .
Get the latest financial news, insights and expert analysis from our award-winning MoneyWeek team, to help you understand what really matters when it comes to your finances.
John is is a British-born lapsed PhD physicist, who previously worked for Nasa on the Mars exploration team. He is a former commodity trading advisor with the US Commodities Futures Trading Commission, and worked in a boutique futures house in California in the 1980s.
He was a partner in one of the first futures newsletter advisory services, based in Washington DC, specialising in pork bellies and currencies. John is primarily a chart-reading trader, having cut his trading teeth in the days before PCs.
As well as his work in the financial world, he has launched, run and sold several 'real' businesses producing 'real' products.
-
 ISA fund and trust picks for every type of investor – which could work for you?
Whether you’re an ISA investor seeking reliable returns, looking to add a bit more risk to your portfolio or are new to investing, MoneyWeek asked the experts for funds and investment trusts you could consider in 2026
-
 The most popular fund sectors of 2025 as investor outflows continue
It was another difficult year for fund inflows but there are signs that investors are returning to the financial markets