Three reasons why the euro faces tough headwinds
The euro is trying to punch through resistance against the US dollar. But things are looking tough for the single currency, says John C Burford.
Get the latest financial news, insights and expert analysis from our award-winning MoneyWeek team, to help you understand what really matters when it comes to your finances.
You are now subscribed
Your newsletter sign-up was successful
Want to add more newsletters?

Twice daily
MoneyWeek
Get the latest financial news, insights and expert analysis from our award-winning MoneyWeek team, to help you understand what really matters when it comes to your finances.

Four times a week
Look After My Bills
Sign up to our free money-saving newsletter, filled with the latest news and expert advice to help you find the best tips and deals for managing your bills. Start saving today!
Today, I'll go through my latest euro trade blow-by-blow. It's been a great trade, and I can use it to show you the things I consider when trading.
I hope my analysis helps you to focus on which factors are worthy of attention and what is unimportant (the news!)
This is a crucial discipline for trading. By focusing on only the relevant factors, you can keep your mind clearly set on the progress of your trade and whether it is conforming to your roadmap.
MoneyWeek
Subscribe to MoneyWeek today and get your first six magazine issues absolutely FREE

Sign up to Money Morning
Don't miss the latest investment and personal finances news, market analysis, plus money-saving tips with our free twice-daily newsletter
Don't miss the latest investment and personal finances news, market analysis, plus money-saving tips with our free twice-daily newsletter
If a trade is behaving contrary to your roadmap, probably something else is going on and it may be best to exit.
I've long been a fan of the EUR/USD market, since it gives me near-perfect tramlines, Fibonacci retracements, and Elliott waves it even sports excellent momentum divergences.
If you've been reading MoneyWeek Trader for a while, you'll know that these are key factors with my trades. So let's see how they fit in with the euro, which I last looked at on 5 March.
The big move down that triggered my short euro trade
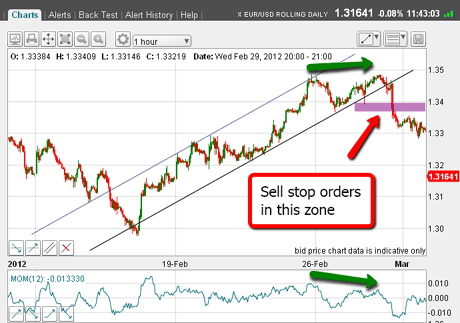
29 February was a big day in the markets. Gold plunged by $100 while the EUR/USD also moved down to fill my sell stop order in the 1.34 area.
You can see my set-up here:
(Click on the chart for a larger version)
I had my sell stop order at the level of the tramline break, since there was a budding negative momentum divergence at the 1.35 area (green arrows).
Also, the rally off the 1.26 January low was in a clear A-B-C pattern. The euro was in a major bear market, so an A-B-C rally is counter-trend, and a resumption of the bear move could be expected after the C wave was put in as it was at the 1.35 area.
The market moved sharply down following my entry. This confirmed my prediction that the bear market was under way again and that my A-B-C labels were correct.
The next question was: where to set my target for exit?
Using the tramlines to exit my position
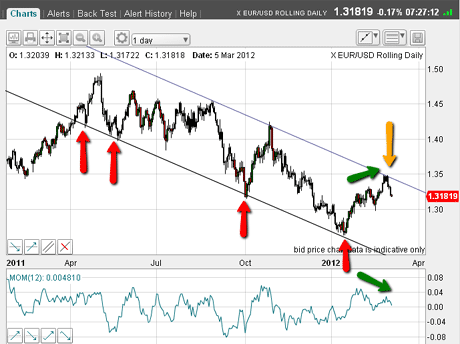
On 5 March, the market had made good progress and I was able to draw a good tramline pair. You can see that again here:
(Click on the chart for a larger version)
In my last look at the euro, I noted a potential positive momentum divergence growing so I had questions about the extent of further downside progress.
As I explained, I had two options: take profits there, or move my protective stop to just above the tramline.
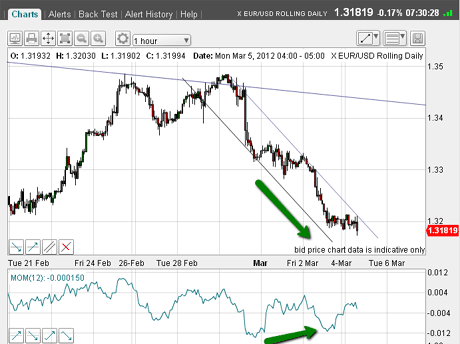
In the event, the market had one further lurch to the downside to the 1.31 level:
(Click on the chart for a larger version)
But look what happened next: after hitting the 1.31 area, the market respected the positive momentum divergence and rallied quite sharply to the precise Fibonacci 50% retrace of the entire move down.
If I was out of the market (we call it being flat'), having taken profits earlier, then that was the place for me to re-enter shorts.
If I was holding my short trade taken at the 1.34 area, then that would have been a great place to add to my short position. My protective stop could have been quite close, giving me a low-risk entry.
As it happened, the market turned back down and approached previous support at the 1.31 area.
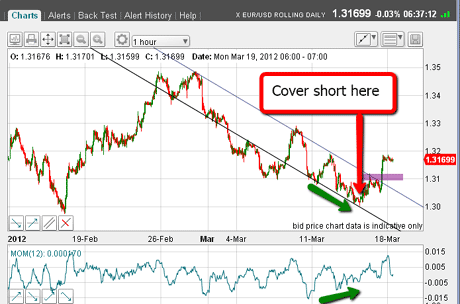
The market then traded lower but within my tramlines:
(Click on the chart for a larger version)
But as the market approached the 1.30 level, I spotted another potential positive momentum divergence and the market was trading right on my new lower tramline!
Time to take profits!
A tramline break means I switch from bear to bull
That was the low for the move and the market then embarked on a rally, which took it above the upper tramline. That's where I had a buy stop order lurking (purple bar) waiting for this to occur.
I love tramline breaks and will gladly switch from being bearish to bullish on just such an event!
So now I am long EUR/USD.
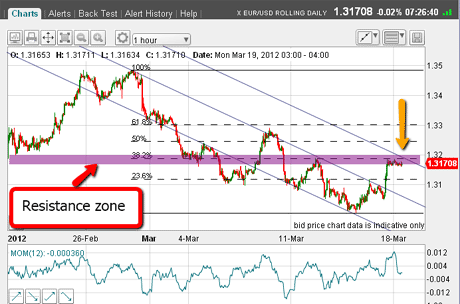
Let's take a closer look:
(Click on the chart for a larger version)
There are three reasons the euro might find it hard to move higher from here.
As I write, the market is trying to punch up past the overhead resistance (purple bar). It is also at the crossing of the third tramline and the Fibonacci 38% retrace (yellow arrow).
Not only that, but there is a clear A-B-C nature to the rally off the 1.30 low!
In other words, the euro has very strong headwinds to contend with.
That is why I have moved my protective stop on my long position to break-even, so I have a free ride. Of course, I could be taking profits here for a nice one-two trade.
To sum up, I took almost 400 pips from my short trade and, at worst, will break even on my long trade. That's a great position to be in for a swing trader!
I hope you found that a useful run through some of the factors I consider when I'm trading. If you have any thoughts, let me know below.
If you're a new reader, or need a reminder about some of the methods I refer to in my trades, then do have a look at my introductory videos:
The essentials of tramline trading
An introduction to Elliott wave theory
Advanced trading with Elliott waves
Don't miss my next trading insight. To receive all my spread betting blog posts by email, as soon as I've written them, just sign up here .
Get the latest financial news, insights and expert analysis from our award-winning MoneyWeek team, to help you understand what really matters when it comes to your finances.
John is is a British-born lapsed PhD physicist, who previously worked for Nasa on the Mars exploration team. He is a former commodity trading advisor with the US Commodities Futures Trading Commission, and worked in a boutique futures house in California in the 1980s.
He was a partner in one of the first futures newsletter advisory services, based in Washington DC, specialising in pork bellies and currencies. John is primarily a chart-reading trader, having cut his trading teeth in the days before PCs.
As well as his work in the financial world, he has launched, run and sold several 'real' businesses producing 'real' products.
-
 ISA fund and trust picks for every type of investor – which could work for you?
Whether you’re an ISA investor seeking reliable returns, looking to add a bit more risk to your portfolio or are new to investing, MoneyWeek asked the experts for funds and investment trusts you could consider in 2026
-
 The most popular fund sectors of 2025 as investor outflows continue
It was another difficult year for fund inflows but there are signs that investors are returning to the financial markets