The euro’s bear market resumes
With the euro having crashed through its support levels, the rally has topped out and the bear market is back. John C Burford looks at how to play it.
Get the latest financial news, insights and expert analysis from our award-winning MoneyWeek team, to help you understand what really matters when it comes to your finances.
You are now subscribed
Your newsletter sign-up was successful
Want to add more newsletters?

Twice daily
MoneyWeek
Get the latest financial news, insights and expert analysis from our award-winning MoneyWeek team, to help you understand what really matters when it comes to your finances.

Four times a week
Look After My Bills
Sign up to our free money-saving newsletter, filled with the latest news and expert advice to help you find the best tips and deals for managing your bills. Start saving today!
Last Friday's article, Forget 13,000 this is the important level for the Dow, prompted lots of comments. There are certainly some strong views about where stocks are heading next, and I'll look at the Dow again soon.
I want to get back to the EUR/USD today, though. It's another market that's seeing a lot of action.
And it's important, too because most markets are dominated by movements in the US dollar.
MoneyWeek
Subscribe to MoneyWeek today and get your first six magazine issues absolutely FREE

Sign up to Money Morning
Don't miss the latest investment and personal finances news, market analysis, plus money-saving tips with our free twice-daily newsletter
Don't miss the latest investment and personal finances news, market analysis, plus money-saving tips with our free twice-daily newsletter
Euro crashes through last week's danger' level
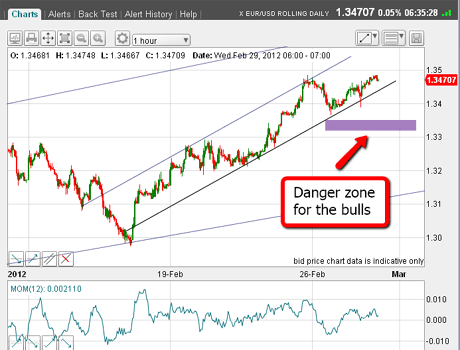
On Wednesday, I noted the bear market rally off the January 1.26 low had taken it easily to my first target at 1.32, and had come within 100 pips or so of my second fantasy' target at 1.36.
I showed you this chart which gave a level where I thought the rally would be in serious trouble:

(Click on the chart for a larger version)
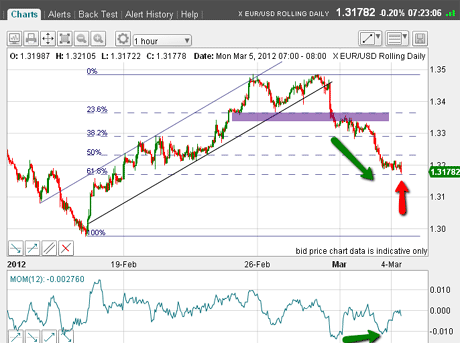
And just look what happened. After writing that article, the market moved sharply down through that purple bar. The next chart shows the position at the time of writing this morning:

(Click on the chart for a larger version)
You can see how, on Wednesday afternoon, the market plunged rapidly through the lower tramline and below the minor support points.
Trader tip: This is a great example of why using stop orders can be a sensible entry method. Using a pre-determined entry level, as I did here, a resting sell stop order would have been triggered automatically. There was no need to be continually scanning my screen.
And using a pre-determined entry level, there is plenty of time to work out a protective stop level in case the market suddenly reverses.
In case you missed it, take a look at the recent tutorial I sent on my 3% rule which explains how I work out my bet sizes and protective stop levels.
The upper tramline halts the bear market rally
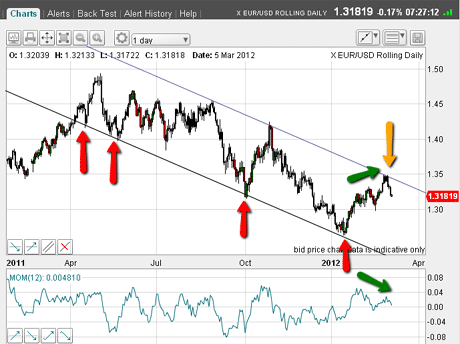
OK, is this a high-probability trade? Let's go to the daily chart to get the big picture:

(Click on the chart for a larger version)
The first task I have is to look for possible tramlines. Right away, I have a great position for my lower tramline just admire the lovely touch-points as marked by the red arrows!
My next task is to look for an upper tramline. And I don't have to look far. It lies on the major highs including the latest rally high at 1.35. So my bear market rally carries right to this tramline. Nice.
Remember, I could have drawn these tramlines in January when the market made its last low at 1.26. This is powerful information.
Also note the potential negative momentum divergence, where the 1.35 high was not matched by higher momentum. This gives added evidence of a rally top at 1.35.
Finally, there is a clear A-B-C pattern to the rally with momentum at the C wave lagging that at the A wave.
With all of this evidence, I have a very strong case that the rally has topped out and the bear market for the euro is intact.
Why caution is needed at this important level
Now, with the market off 200 pips or so from my trade entry, I can lower my protective stop to break-even, following my break-even rule.
But I must not get too carried away here. As always, I must be vigilant for surprises, especially if trading in the short term.
Why am I cautious here? This morning, the market has fallen to the 38% Fibonacci retrace of the rally (see red arrow on second chart, which I'll repeat below) a typical level where support is found.

(Click on the chart for a larger version)
Also, there is a potential positive momentum divergence (marked by the green arrows) this is often a prelude to a reversal of some kind.
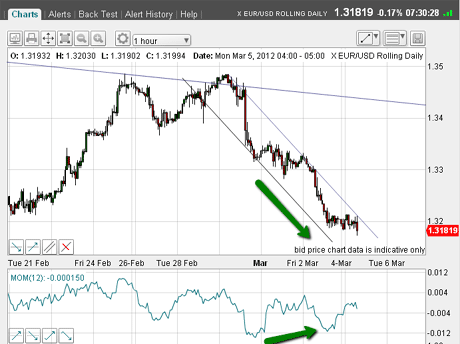
But as you can see from this next chart, so far the decline is following my new down-sloping tramlines, so all is well so far.

(Click on the chart for a larger version)
If I were trading short-term, I would be tempted to take profits here, or set a buy-stop just above my upper tramline.
Both methods are acceptable. If taking profits here, I would have a known profit in the bank, but miss out on any further falls.
If using the second method and the market rallied through my stop, I would take a smaller profit. But I have the chance to benefit further if the market continues down.
Which method to choose in your own trading depends on your personality it's horses for courses!
Now, I promised you I would cover gold this week and that's still the plan. I hope to get to it on Wednesday and I'll have a very interesting chart to show you!
If you're a new reader, or need a reminder about some of the methods I refer to in my trades, then do have a look at my introductory videos:
The essentials of tramline trading
An introduction to Elliott wave theory
Advanced trading with Elliott waves
Don't miss my next trading insight. To receive all my spread betting blog posts by email, as soon as I've written them, just sign up here .
Get the latest financial news, insights and expert analysis from our award-winning MoneyWeek team, to help you understand what really matters when it comes to your finances.
John is is a British-born lapsed PhD physicist, who previously worked for Nasa on the Mars exploration team. He is a former commodity trading advisor with the US Commodities Futures Trading Commission, and worked in a boutique futures house in California in the 1980s.
He was a partner in one of the first futures newsletter advisory services, based in Washington DC, specialising in pork bellies and currencies. John is primarily a chart-reading trader, having cut his trading teeth in the days before PCs.
As well as his work in the financial world, he has launched, run and sold several 'real' businesses producing 'real' products.
-
 Average UK house price reaches £300,000 for first time, Halifax says
While the average house price has topped £300k, regional disparities still remain, Halifax finds.
-
 Barings Emerging Europe trust bounces back from Russia woes
Barings Emerging Europe trust has added the Middle East and Africa to its mandate, delivering a strong recovery, says Max King