How to apply my 3% rule in a real life trade
John C Burford explains how to avoid losing more than you can afford when spread betting by using his '3% rule'.
Get the latest financial news, insights and expert analysis from our award-winning MoneyWeek team, to help you understand what really matters when it comes to your finances.
You are now subscribed
Your newsletter sign-up was successful
Want to add more newsletters?

Twice daily
MoneyWeek
Get the latest financial news, insights and expert analysis from our award-winning MoneyWeek team, to help you understand what really matters when it comes to your finances.

Four times a week
Look After My Bills
Sign up to our free money-saving newsletter, filled with the latest news and expert advice to help you find the best tips and deals for managing your bills. Start saving today!
As you know, I am a fierce advocate of risk management. I always use protective stops on swing trades.
That's why I created my 3% rule. It's one way I can limit risk on any trade, if that trade goes wrong. In fact, I consider this rule as a major part of my 'wealth and safety' regulations!
With my approach, I'm trading market swings that can last typically from a few days to a few weeks. I try to get into long trades near a low and to exit near a high so as to capture most of the price swing. If I'm shorting, the reverse holds, of course.
MoneyWeek
Subscribe to MoneyWeek today and get your first six magazine issues absolutely FREE

Sign up to Money Morning
Don't miss the latest investment and personal finances news, market analysis, plus money-saving tips with our free twice-daily newsletter
Don't miss the latest investment and personal finances news, market analysis, plus money-saving tips with our free twice-daily newsletter
How I use my 3% rule to limit my losses
When I trade, my aim is to try to capture at least 50% of a swing. That's my ideal. Naturally, some trades fail, and I have my 3% rule to limit losses.
I'm looking to short strength and buy weakness in declines, and vice versa for rallies.
I have two primary methods for judging my entries the Fibonacci retracements and my tramline trading method.
Let me give you an example of using the 3% Rule when looking for a short entry using the tramline trading method.
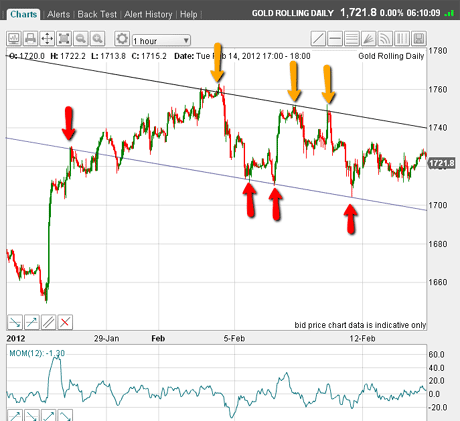
I have here the hourly chart of gold:

(Click on the chart for a larger version)
First, I draw the lower tramline. This takes in the significant lows as marked by the red arrows.
Then, I draw my upper parallel line, which takes in the highs as marked by the yellow arrows.
Looking at this chart, recent trading has been bounded by my tramlines. I have no reason (yet) to suspect that the market is ready to move outside this channel.
For that reason, I believe shorting near the upper tramline could result in a profitable move down. That is what the odds are telling me.
Conversely, if the market can trade at the lower tramline, that should be a good buying opportunity.
Let's see how the market developed:

(Click on the chart for a larger version)
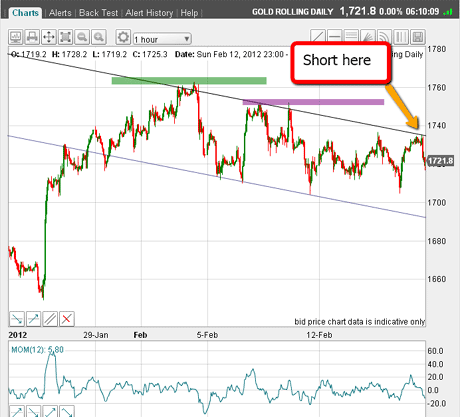
As you can see, the market rallied to the upper tramline. So I might put out a short trade in the $1,735 area.
But before I trade, I must be prepared with the correct bet size for my account. And I must have a stop-loss placement ready to go.
Here's how I'd work that out
How to work out how much to place on a trade
Let's say I'm trading off a £10,000 account. If my maximum allowable loss is 3%, that equates to £300 per trade.
Let's say the trade goes wrong and the market continues upwards above the tramline. Where should I admit that I'm wrong?
I have shown two possibilities on the above chart, marked by the purple bar (at the $1,752 area) and by the green bar (at the $1,762 area). These are sensible stop-loss areas, as they both have been areas of previous resistance.
If I was nervous about the trade, I might choose the lower bar. This would imply a loss of 170 pips. That's the difference between my entry and my stop levels. In other words, $1,752 (stop) minus $1,735 (entry) = $17 per oz = 170 pips (one pip is $0.10 per ounce on the gold price with my spread betting company).
Now as I said earlier, my maximum loss is set at £300. That means that my maximum bet size would be £300/170 = approximately £2 per pip. That is the correct bet size for this stop.
Trader tip:Some spread betting companies use $0.01 as their gold pip, so you need to make adjustments. Check with your spread betting provider.
Adjusting the bet size for a wider stop
Now let's look at the same example, but using the higher stop level on the chart. If I wish to give the trade more room, I would choose the upper stop level at $1,762. If the market rallied to this level, it would imply a loss of $1,762 (stop) - $1735 (entry) = $27 per oz = 270 pips.
My maximum loss is still set at £300, so my maximum bet size would be £300/270 = roughly £1 per pip. That is the correct bet size for this stop.
So already, I have two options some traders would take the lower stop and others the higher stop. It all comes down to risk appetite.
There is no such thing as the 'best' place to set stops either one is legitimate.
You must choose according to your own trading personality! But do be consistent don't chop and change your strategy just because you have suffered a series of losses.
You should make these calculations well before making the trade trading on the hoof can work, but is not advised.
Why setting a stop loss too tight can be costly
It's important to note that there is such a thing as setting stops too tightly. Do this and you will likely suffer loss after loss.
How do you know if your stops are too tight? That's a good question. One way is this: Just glancing at the gold chart, you can see that volatility is such that daily ranges average around $30 from the day's low to the high.
My own guideline is that stops should rarely be less that 50% of the average daily range in this case $15 or so. OK, we have examined two worst-case scenarios.
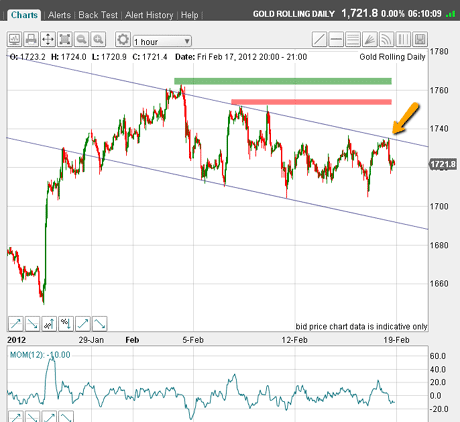
Now, let's see how this trade is working, as at 17 February when I'm writing this:

(Click on the chart for a larger version)
Well it looks pretty good so far as you can see, I have caught the high (so far) and the market is falling in my favour.
The question is, should I now lower my stop following my break-even rule? After all, I don't want to suffer a loss now that the market is moving in my direction. But has the market moved enough in my direction where it is safe' to move stops down?
Working out when to move a stop
I entered my short at $1,735 and the latest market is $1,721 a move in my favour of $14. That's almost the same size as the loss if the market moved up to the lower stop loss ($1,752) if I left the stop intact.
If I chose the upper stop, this $14 gain would be about half of the loss if the market moved up to that stop if I left that stop intact.
To me, this is in no-man's land here. Personally, I would move my stop to break-even in both cases as the upper tramline has proved powerful enough to stop the rallies right on the line.
If there is enough strength to force the market up through this line, the market should carry on much higher as buy-stops are hit, and I want to be out of the market if this occurs.
So, with my stop loss at break-even, now I have a free ride. If the market falls to the lower tramline at the $1,685 area, that would represent a potential gain of $50 per oz.
At £1 per pip, that is a gain of £500, or 5% of a £10,000 account. At £2 per pip, that is a gain of £1,000, or 10% of the account.
This illustrates that the higher-risk trade (lower stop-loss) is better rewarded, as it should.
So traders will then have a choice to take profits or not? That is where an analysis of the longerrange charts can help.
In this simple example, I hope I have shown that traders must be making choices all the time choices that fit in with their own trading style.
The key in good trading is to minimise risk. And that's what my 3% rule is about.
Remember, as spread betters we are dealing here with highly leveraged products. Trading can be dangerous unless you understand the risks and can handle them professionally.
If you're a new reader, or need a reminder about some of the methods I refer to in my trades, then do have a look at my introductory videos:
The essentials of tramline trading
An introduction to Elliott wave theory
Advanced trading with Elliott waves
Don't miss my next trading insight. To receive all my spread betting blog posts by email, as soon as I've written them, just sign up here .
Get the latest financial news, insights and expert analysis from our award-winning MoneyWeek team, to help you understand what really matters when it comes to your finances.
John is is a British-born lapsed PhD physicist, who previously worked for Nasa on the Mars exploration team. He is a former commodity trading advisor with the US Commodities Futures Trading Commission, and worked in a boutique futures house in California in the 1980s.
He was a partner in one of the first futures newsletter advisory services, based in Washington DC, specialising in pork bellies and currencies. John is primarily a chart-reading trader, having cut his trading teeth in the days before PCs.
As well as his work in the financial world, he has launched, run and sold several 'real' businesses producing 'real' products.
-
 Average UK house price reaches £300,000 for first time, Halifax says
While the average house price has topped £300k, regional disparities still remain, Halifax finds.
-
 Barings Emerging Europe trust bounces back from Russia woes
Barings Emerging Europe trust has added the Middle East and Africa to its mandate, delivering a strong recovery, says Max King