The euro attacks my 1.36 target
The euro has made good progress recently towards John C Burford's long-standing target. Here, he looks at where it's going next.
Get the latest financial news, insights and expert analysis from our award-winning MoneyWeek team, to help you understand what really matters when it comes to your finances.
You are now subscribed
Your newsletter sign-up was successful
Want to add more newsletters?

Twice daily
MoneyWeek
Get the latest financial news, insights and expert analysis from our award-winning MoneyWeek team, to help you understand what really matters when it comes to your finances.

Four times a week
Look After My Bills
Sign up to our free money-saving newsletter, filled with the latest news and expert advice to help you find the best tips and deals for managing your bills. Start saving today!
I've had a great break away from the markets in the sun. Now it's time to catch up with what's going on in my favourite markets.
Incidentally, while I was away I was not tempted to check on the markets. And that means that today I feel I can view them with (almost) fresh eyes.
I really do recommend the occasional complete break I think every trader can benefit from it.
MoneyWeek
Subscribe to MoneyWeek today and get your first six magazine issues absolutely FREE

Sign up to Money Morning
Don't miss the latest investment and personal finances news, market analysis, plus money-saving tips with our free twice-daily newsletter
Don't miss the latest investment and personal finances news, market analysis, plus money-saving tips with our free twice-daily newsletter
So what's been going on?
I see the EUR/USD has made even more progress towards my long-standing 1.36 target while I was away. It's trading a little over 100 pips beneath it as I write this.
I'll show you exactly what the euro's being up to in today's issue.
How the 3% rule helps keep losses manageable
Before that, I'd just like to clear something up that some readers queried from my article of 20 February.
In it, I was looking at the possibility of a short trade. I thought the odds favoured a resumption of the euro's decline, but said it wasn't a watertight case.
So I showed a possible trade with an example of how I use my 3% rule. This allowed me several options regarding bet sizes. That's a key factor in helping me determine bet size, if I'm unsure.
As it happened, that trade was a bust, and the "losses" were as indicated in my article.
But that did not prevent the trade being a decent one, as I had adhered to all of my trading rules. The split bet with the fictitious £10,000 account was a conservative strategy and meant that the loss was only 1.4% of the account.
Trader Tip: I recommend you study that article to gain an understanding of how you can incorporate the 3% rule into your own trading. Also look at: How to apply my 3% rule in a real-life trade. There are even more permutations of bet sizes that could work and I encourage you to explore this area. Your choice of strategy will depend on your personality if you are a conservative soul, you should bet conservatively, for instance.
Using tramlines to pinpoint a possible target for the euro
OK, so with the market this morning still in its bear market rally phase, how are the charts looking?
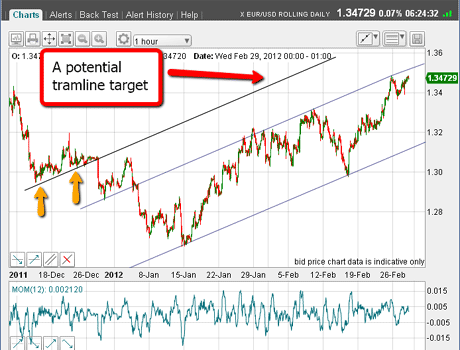
Here is the hourly chart:

(Click on the chart for a larger version)
I have drawn very impressive tramlines the lower one connects the two major lows and the central one passes right through other major highs and lows.
See how the market's rally to 1.3480 last Friday took it right to this central tramline and then backed off.
This shows the power of tramlines as lines of support and resistance into the future even though I drew them well before the market made it there on Friday.
I have put the upper tramline in as something to watch in case the market catches a bid and pushes up through the central line. The yellow arrows mark important lows.
If the market does make it to that upper tramline, I would expect it to occur in a spike action a quick up and then a quick down. We shall see.
The euro is at a significant resistance level
Now it's time to look at the bigger daily picture to see where we are in the great scheme of things:

(Click on the chart for a larger version)
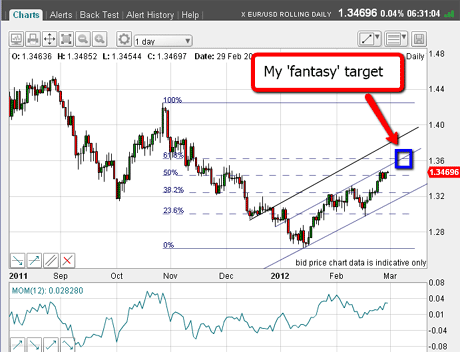
At current levels, the market is challenging the Fibonacci 50% retrace of the big wave down off the November 1.42 high to the January 1.26 low. That, of course, is significant resistance, and the rally could well terminate here.
What is the evidence to suggest that? For one thing, the form of the rally can be counted as an A-B-Cwith the market currently finishing up the C wave. Remember, C waves are ending waves.
And for another thing, there is a potential negative momentum divergence forming between the A and the C waves.
I still have my fantasy'1.36 target as the meeting of the 62% Fibonacci retrace and my central tramline as marked by my blue box on the chart.
Naturally, if the market does make it, it will no longer be a fantasy! But it was in January as the market was plumbing new depths.
A close-up offers clues to where the euro could head next
So what next? Well, if the market decides to continue upwards, the next logical target would be around the upper tramline in the 1.38 1.40 zone.
Now that would make the bears squeal!
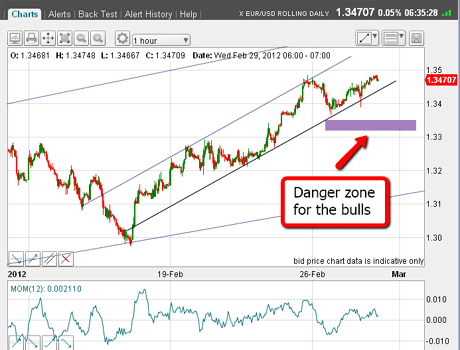
But can I get a better view of the situation? Here is the hourly chart highlighting the rally off the 16 February low:

(Click on the chart for a larger version)
You can see that the rally has continued along a good pair of tramlines which sport very good touch points.
The market could now fall back off the Fibonacci 50% resistance. If it does, the danger zone for the bullish case would be the area marked by my purple bar. That might be a good area for me to look for a short trade and/or to exit long positions.
We'll have to wait and see.
On Friday, I hope to look at the Dow. It's got people excited as it has recently reached the 13,000 level, which is around the upper limit of my rising wedge pattern.
Bullishness reigns but for how much longer? More soon
If you're a new reader, or need a reminder about some of the methods I refer to in my trades, then do have a look at my introductory videos:
The essentials of tramline trading
An introduction to Elliott wave theory
Advanced trading with Elliott waves
Don't miss my next trading insight. To receive all my spread betting blog posts by email, as soon as I've written them, just sign up here .
Get the latest financial news, insights and expert analysis from our award-winning MoneyWeek team, to help you understand what really matters when it comes to your finances.
John is is a British-born lapsed PhD physicist, who previously worked for Nasa on the Mars exploration team. He is a former commodity trading advisor with the US Commodities Futures Trading Commission, and worked in a boutique futures house in California in the 1980s.
He was a partner in one of the first futures newsletter advisory services, based in Washington DC, specialising in pork bellies and currencies. John is primarily a chart-reading trader, having cut his trading teeth in the days before PCs.
As well as his work in the financial world, he has launched, run and sold several 'real' businesses producing 'real' products.
-
 Can mining stocks deliver golden gains?
With gold and silver prices having outperformed the stock markets last year, mining stocks can be an effective, if volatile, means of gaining exposure
-
 8 ways the ‘sandwich generation’ can protect wealth
People squeezed between caring for ageing parents and adult children or younger grandchildren – known as the ‘sandwich generation’ – are at risk of neglecting their own financial planning. Here’s how to protect yourself and your loved ones’ wealth.