The euro rallies to an important Fibonacci level
The euro has rallied to an important level. But the odds favour a fall from here, says John C Burford. Here he looks for clues on how to trade it.
Get the latest financial news, insights and expert analysis from our award-winning MoneyWeek team, to help you understand what really matters when it comes to your finances.
You are now subscribed
Your newsletter sign-up was successful
Want to add more newsletters?

Twice daily
MoneyWeek
Get the latest financial news, insights and expert analysis from our award-winning MoneyWeek team, to help you understand what really matters when it comes to your finances.

Four times a week
Look After My Bills
Sign up to our free money-saving newsletter, filled with the latest news and expert advice to help you find the best tips and deals for managing your bills. Start saving today!
On the back of yet another supposed 'rescue' for Greece today, the EUR/USD has rallied off last week's sub-1.30 low to an importantFibonacci retrace level.
I will get to this later.
But first, let's go back to my article of 8 February. At the time, I noted that the market seemed to be in a good position to extend the 600-pip rally off the January 1.26 low.
MoneyWeek
Subscribe to MoneyWeek today and get your first six magazine issues absolutely FREE

Sign up to Money Morning
Don't miss the latest investment and personal finances news, market analysis, plus money-saving tips with our free twice-daily newsletter
Don't miss the latest investment and personal finances news, market analysis, plus money-saving tips with our free twice-daily newsletter
Previously, I had a possible 1.36 target in mind for the euro. Meanwhile, my first long-held 1.32 target was duly attained.
Why it can pay to take the uncomfortable position
When I set these targets, the market was in freefall and sentiment was extremely bearish. How comforting it would have been to join the herd! I would have had lots of company with most of the pundits bolstering my stance! And I would be feeling very confident.
But always remember: markets exist to inflict the most pain on the majority and no more so than at major turning points. Confidence can turn to panic very quickly if you are on the wrong side of a turn, as we saw last month. No trader should be in this position.
Trader tip: Train yourself to be flexible and to become more bearish as markets rally, and more bullish as they fall, especially after a long trend.
OK, let's see if market action since my last article has caused me to amend my cautiously bullish stance.
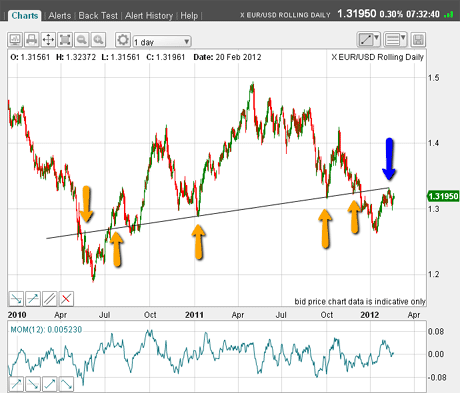
Here is the daily chart to get a long-term perspective:

(Click on the chart for a larger version)
I have drawn an impressive trendline that picks up many of the important highs and lows (yellow arrows).
The market's rally off the 1.26 low carried right to the underside of this trendline on 9 February and then backed off. The market still believes this line to be highly significant as a line of either support or resistance.
If my 1.36 target is to be hit, the resistance at this line would need to give way. That would be a tall order, of course.
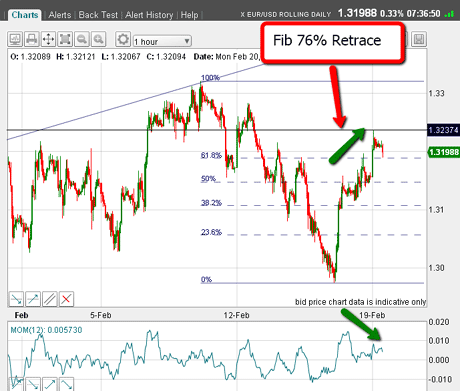
Then, the market found support last week and the overnight rally has carried to the exact Fibonacci 76% retrace:

(Click on the chart for a larger version)
The hit' occurred on a spike and note the potential negative momentum divergence marked by the green arrows.
Also, the rally off the Thursday low can be counted an A-B-C Elliott wavepattern, which is corrective to the main trend. This suggests the main trend is still down, of course.
Why the odds favour a decline from here
With the above evidence, I believe the odds do favour a resumption of the decline here. But the case is not watertight, by any means.
Of course, we are always dealing with the balance of probabilities in the markets.
If the market does fall from here, a confirmation of the bear market would likely come if last Thursday's low at 1.30 is breached.
So how could I play a trade here as a swing trader?
The market as I write is at 1.3190. If my interpretation is correct, then the Fibonacci retrace at 1.3240 should hold. (If it doesn't, then something else is going on and it is prudent for me to stand aside until the fog clears).
So I elect to set my protective buy-stop at 1.3260 20 pips above the Fibonacci level. That gives me a stop loss of 70 pips from entry.
How to manage risk on a trade
Based on trading a £10,000 account, say, my maximum allowable loss is £300, based on my 3% rule. That means my maximum bet size is £4 a pip.
Of course, I am at liberty to bet a smaller size. In fact, a more conservative strategy would be to bet here at £2 a pip, and if the trade moves in my favour, to add another short trade later on with the other £2, meanwhile moving stops down.
But if the first trade moves against me, I would be stopped out for a £140 loss only 1.4% of that £10,000 account.
Naturally, with trades like this, if I can time an entry closer to a major Fibonacci level, so much the better, as my stop-loss could be set tighter.
But on this occasion, this spike hit occurred yesterday during the Sunday trading session. I don't know about you, but I am doing other things at that time on a Sunday. So I have to do the best I can as always!
I'll be taking a break this week and next. I'll be away now until 29 February.
In the meantime, keep an eye out for my article on my 3% rule. And if you get the chance, remember to take a look at the trading videos I have recorded for you you'll find them below.
With the markets setting up for some dramatic moves, I will have lots to cover in my next article on 29 February.
If you're a new reader, or need a reminder about some of the methods I refer to in my trades, then do have a look at my introductory videos:
The essentials of tramline trading
An introduction to Elliott wave theory
Advanced trading with Elliott waves
Don't miss my next trading insight. To receive all my spread betting blog posts by email, as soon as I've written them, just sign up here .
Get the latest financial news, insights and expert analysis from our award-winning MoneyWeek team, to help you understand what really matters when it comes to your finances.
John is is a British-born lapsed PhD physicist, who previously worked for Nasa on the Mars exploration team. He is a former commodity trading advisor with the US Commodities Futures Trading Commission, and worked in a boutique futures house in California in the 1980s.
He was a partner in one of the first futures newsletter advisory services, based in Washington DC, specialising in pork bellies and currencies. John is primarily a chart-reading trader, having cut his trading teeth in the days before PCs.
As well as his work in the financial world, he has launched, run and sold several 'real' businesses producing 'real' products.
-
 Average UK house price reaches £300,000 for first time, Halifax says
While the average house price has topped £300k, regional disparities still remain, Halifax finds.
-
 Barings Emerging Europe trust bounces back from Russia woes
Barings Emerging Europe trust has added the Middle East and Africa to its mandate, delivering a strong recovery, says Max King