A textbook move catches out the Dow's bears
The battle between the bulls and the bears is currently being won by the bulls as the Dow Jones provides a textbook example of how counter-trend moves within a larger bear market can catch traders out.
Get the latest financial news, insights and expert analysis from our award-winning MoneyWeek team, to help you understand what really matters when it comes to your finances.
You are now subscribed
Your newsletter sign-up was successful
Want to add more newsletters?

Twice daily
MoneyWeek
Get the latest financial news, insights and expert analysis from our award-winning MoneyWeek team, to help you understand what really matters when it comes to your finances.

Four times a week
Look After My Bills
Sign up to our free money-saving newsletter, filled with the latest news and expert advice to help you find the best tips and deals for managing your bills. Start saving today!
The Dow is providing a textbook example of how powerful counter-trend moves within a larger bear market can catch many traders out and can extend much farther than most expect.
On Monday, I pointed out that many traders had jumped onto the short bandwagon because the economic "fundamentals" had worsened.
Investor sentiment measures were turning markedly bearish as the Dow fell to the lows of last week.
MoneyWeek
Subscribe to MoneyWeek today and get your first six magazine issues absolutely FREE

Sign up to Money Morning
Don't miss the latest investment and personal finances news, market analysis, plus money-saving tips with our free twice-daily newsletter
Don't miss the latest investment and personal finances news, market analysis, plus money-saving tips with our free twice-daily newsletter
That was one huge warning light to me. And because I counted a complete five Elliott waves down from the May high, the scene was set for this rebound rally.
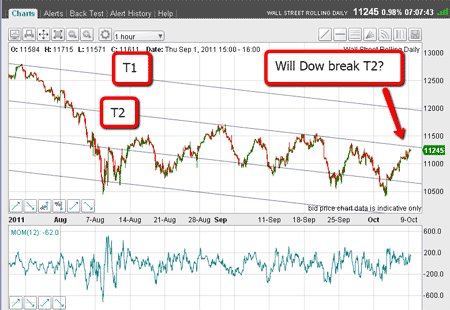
On Monday, the market was toying with my T2 tramline:

(Click on the chart for a larger version)
My first thought was that the market might top out at T2 (momentum was getting overstretched) in my A wave, then fall to make a B wave, and then rally to a new recovery high in the C wave.
That would be the 'perfect' scenario.
But the market, as often happens, had other ideas.
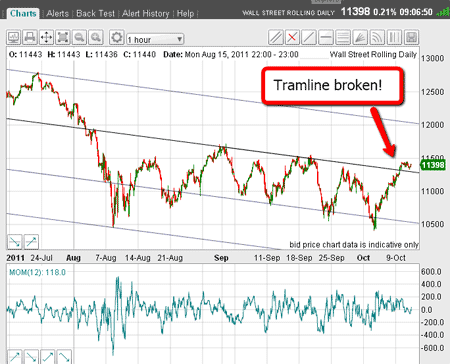
Yesterday, we did get a dip, but it recovered from it and this morning, the market punched up strongly through T2.

(Click on the chart for a larger version)
This move has taken out the previous high of 27 September, and is challenging the previous high of 20 September.
As I said before, the buy-stops placed by the shorts are being taken out. Now these shorts are nursing losses and have a sore head trying to figure out why the market is acting so perversely the short trade looked a no-brainer.
The rally comes as no surprise
But if they had studied the Elliott waves and paid attention to market sentiment, this rally would not have come as a surprise at all.
Let's take a close-up view of this rally. Here is the hourly chart from last Tuesday's low:

(Click on the chart for a larger version)
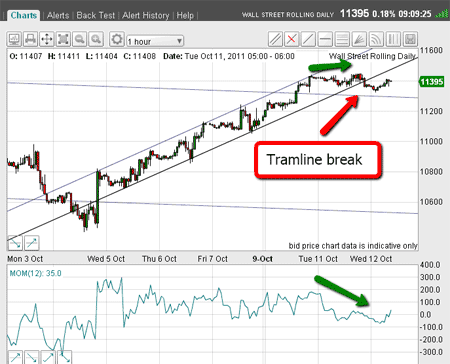
The rally has been following my tramlines perfectly, but yesterday, we had a break of the lower one. The top was also made on a potential negative momentum divergence.
That was a warning sign that the market was making my A wave and was getting ready to fall.
In fact, I placed sell orders just under the lower tramline, but felt unsure about this trade.
Why? Because tramline breaks are often followed by a rebound to challenge the underside of the tramline.
To see examples of this feature of tramlines, see my tutorial video: An introduction to tramline trading.
Because of this probability, I was quick to move my protective buy-stops to break even, and was taken out this morning.
Trading tip: Because my short-term tramlines possessed a steep slope, any rebound to the underside of my lower tramline would take the market up beyond the risk I was willing to place on this trade. Keep this in mind when placing your trades in this way.
The moment of truth
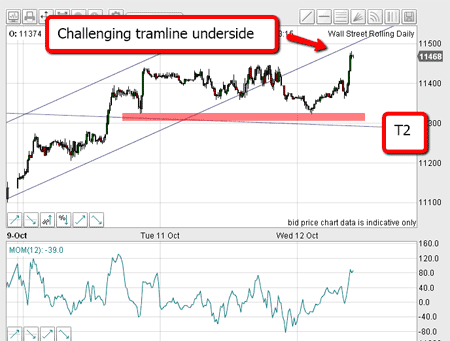
As I write, the market has rallied to very close to the tramline underside:

(Click on the chart for a larger version)
This is the moment of truth!
If I were an adventurous trader I would want to short here. Momentum is getting over-stretched, and protective stops can be set quite close to a point just above the lower tramline.
If we see a 'scalded cat bounce' down, my protective stops could be swiftly moved to break-even, following my break-even rule.
In fact, this would be a textbook trade, no matter how it turns out.
And if the market does fall and break support at the purple bar, which lies close to T2, the odds will definitely swing towards my scenario of a dip to a B wave possibly 200 pips or so away.
The Dow story is definitely getting very exciting! But to stay out of trouble, traders need to be nimble.
If you're a new reader, or need a reminder about some of the methods I refer to in my trades, then do have a look at my introductory videos:
The essentials of tramline trading
An introduction to Elliott wave theory
Don't miss my next trading insight. To receive all my spread betting blog posts by email, as soon as I've written them, just sign up here .
Get the latest financial news, insights and expert analysis from our award-winning MoneyWeek team, to help you understand what really matters when it comes to your finances.
John is is a British-born lapsed PhD physicist, who previously worked for Nasa on the Mars exploration team. He is a former commodity trading advisor with the US Commodities Futures Trading Commission, and worked in a boutique futures house in California in the 1980s.
He was a partner in one of the first futures newsletter advisory services, based in Washington DC, specialising in pork bellies and currencies. John is primarily a chart-reading trader, having cut his trading teeth in the days before PCs.
As well as his work in the financial world, he has launched, run and sold several 'real' businesses producing 'real' products.
-
 Last chance to invest in VCTs? Here's what you need to know
Investors have pumped millions more into Venture Capital Trusts (VCTS) so far this tax year, but time is running out to take advantage of tax perks from them.
-
 ISA quiz: How much do you know about the tax wrapper?
Quiz One of the most efficient ways to keep your savings or investments free from tax is by putting them in an Individual Savings Account (ISA). How much do you know about ISAs?