Is this the start of a big rally in the Dow?
The Dow Jones rallied strongly since its low early last week. So is this the start of something big? John C Burford looks for clues in the charts.
Get the latest financial news, insights and expert analysis from our award-winning MoneyWeek team, to help you understand what really matters when it comes to your finances.
You are now subscribed
Your newsletter sign-up was successful
Want to add more newsletters?

Twice daily
MoneyWeek
Get the latest financial news, insights and expert analysis from our award-winning MoneyWeek team, to help you understand what really matters when it comes to your finances.

Four times a week
Look After My Bills
Sign up to our free money-saving newsletter, filled with the latest news and expert advice to help you find the best tips and deals for managing your bills. Start saving today!
On Friday, I posed the question: Which way now for the Dow?
If you recall, we saw a low on Tuesday at 10,400. That was possibly the fifth Elliott wave I had been looking for, and covered my shorts near the low, as the momentum was sporting a positive momentum divergence, and I expected some sort of rally.
The market did indeed rally strongly from this low.
MoneyWeek
Subscribe to MoneyWeek today and get your first six magazine issues absolutely FREE

Sign up to Money Morning
Don't miss the latest investment and personal finances news, market analysis, plus money-saving tips with our free twice-daily newsletter
Don't miss the latest investment and personal finances news, market analysis, plus money-saving tips with our free twice-daily newsletter
Also last week, the sentiment was extremely bearish, as even a cursory scan of the mainstream articles demonstrated.
Naturally, since the market always surprises the majority at least the majority of non-professionals the rally since Tuesday has been squeezing the shorts who have been jumping on board since early August, when the market made its wave 3 low at 10,450.
Why have so many traders turned bearish?
It all seemed so obvious the eurozone was collapsing, sovereign debt prices were plunging, world GDP was weakening. What more obvious trade was there but to short stocks?
But in the words of financial writer Joe Granville, "What seems obvious to the majority is obviously wrong". I like to recall this aphorism when in situations such as those we have today.
First, bullish enthusiasm was rampant in May when the market made its top. This enthusiasm waned as the market fell from this high, as was to be expected.
Being a contrarian can really pay off when sentiment reaches extremes, but going against all received wisdom can be difficult for some traders.
Second, when the big summer collapse resulted in the early August 10,450 low, sentiment was at rock-bottom.
Incidentally, there are several very good measures of sentiment available in the US markets. As I mentioned, simply scanning the headlines of financial articles in the mainstream press can be very revealing.
So, with the market washed out in early August, there was only one way for it to go and that was up.
Since then, the market has traded in a very wide range, as the battle between bulls and bears has been intense.
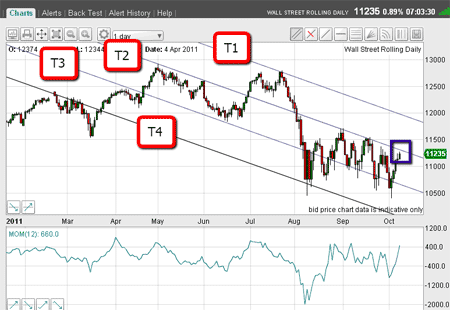
Just compare the size of the daily 'candlesticks' since the August low to those before it.

(Click on the chart for a larger version)
The daily ranges have become much greater, showing the increased conflict. That makes trading that much harder! Trade timing must be precise.
Trading tip: This is a period where losses can easily mount up, and so I advise using smaller bets.
Where will this rally top out?
I have drawn my latest tramline positions with the market approaching T2. If the market can break above, my target will be T1 in the 11,600 11,700 zone.
But, as I mentioned on Friday, I do expect some form of an A-B-C pattern before the rally tops out.
So far, I believe we are in wave A, and I am waiting for a dip to make the B wave. That is my first guess.
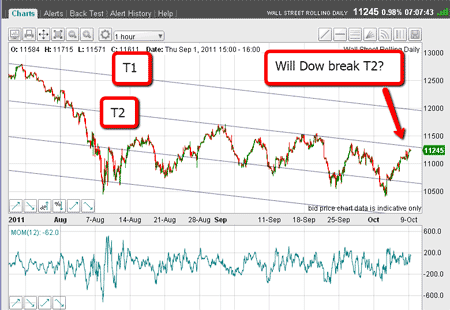
But where will my suggested wave A top out? Here is a close-up chart:

(Click on the chart for a larger version)
The market is approaching T2 as I write. That would be a logical place.
But it is possible we could see a break through it. That would put my upside target at T1.
If the market can do this, it will set off a huge number of buy-stops that must be lurking just above the recent highs.
That would be one explosive move and one that most people would see as unexpected!
But my money right now is for a wave A high to be made soon, likely near current levels, or just above at T2.
Then a wave B dip, and then a rally in a C wave that could take out those buy-stops above the recent highs.
But as of now, I shall continue to watch and wait as the bulls and bears slug it out.
My plan will be to look for the A wave top, using my usual methods, where I may be shorting again, but with an eye on a low in the B wave.
My big trade will be to look to short at the C wave I hope we get one!
If you're a new reader, or need a reminder about some of the methods I refer to in my trades, then do have a look at my introductory videos:
The essentials of tramline trading
An introduction to Elliott wave theory
Don't miss my next trading insight. To receive all my spread betting blog posts by email, as soon as I've written them, just sign up here .
Get the latest financial news, insights and expert analysis from our award-winning MoneyWeek team, to help you understand what really matters when it comes to your finances.
John is is a British-born lapsed PhD physicist, who previously worked for Nasa on the Mars exploration team. He is a former commodity trading advisor with the US Commodities Futures Trading Commission, and worked in a boutique futures house in California in the 1980s.
He was a partner in one of the first futures newsletter advisory services, based in Washington DC, specialising in pork bellies and currencies. John is primarily a chart-reading trader, having cut his trading teeth in the days before PCs.
As well as his work in the financial world, he has launched, run and sold several 'real' businesses producing 'real' products.
-
 Should you buy an active ETF?
ETFs are often mischaracterised as passive products, but they can be a convenient way to add active management to your portfolio
-
 Power up your pension before 5 April – easy ways to save before the tax year end
With the end of the tax year looming, pension savers currently have a window to review and maximise what’s going into their retirement funds – we look at how