Get the latest financial news, insights and expert analysis from our award-winning MoneyWeek team, to help you understand what really matters when it comes to your finances.
You are now subscribed
Your newsletter sign-up was successful
Want to add more newsletters?

Twice daily
MoneyWeek
Get the latest financial news, insights and expert analysis from our award-winning MoneyWeek team, to help you understand what really matters when it comes to your finances.

Four times a week
Look After My Bills
Sign up to our free money-saving newsletter, filled with the latest news and expert advice to help you find the best tips and deals for managing your bills. Start saving today!
Welcome back.
In this week’s issue of the magazine, we look at the “Great Reset”, touted by the great and the good as a new beginning for the global economy – but, as Stuart Watkins argues, there is very little that is new about it and quite a lot to dislike. We also look at the vast potential of emerging Asia and the best ways to buy in. If you’re not already a subscriber, sign up now and get your first six mags free.
Our latest “Too Embarrassed To Ask” video looks at “technical analysis” as favoured by many investors who like to spot patterns in charts that, they say, give them an insight into where markets might go next. Find out more about it in our video here.
MoneyWeek
Subscribe to MoneyWeek today and get your first six magazine issues absolutely FREE

Sign up to Money Morning
Don't miss the latest investment and personal finances news, market analysis, plus money-saving tips with our free twice-daily newsletter
Don't miss the latest investment and personal finances news, market analysis, plus money-saving tips with our free twice-daily newsletter
As is now usual, we have a new podcast. This time John is in the chair, talking to Dr Paul Jourdan of Amati Global investors. Paul is launching a new fund investing in the “strategic metals” that are needed if we are to move away from fossil fuels. Have a listen to what he’s got to say here.
Here are the links for this week’s editions of Money Morning and other web stories you may have missed.
- Monday: Which assets do best when inflation is rising?
- Merryn’s blog: Neil Woodford’s back – but has he really learned anything?
- Tuesday: Why you should pay attention when investment trusts raise new money
- Wednesday: The days when you could get 7% from your bank are long gone – so what do you do?
- Thursday: Are we heading for another bond market tantrum?
- Friday: Expect more turbulence as the market calls central bankers’ bluff
Now for the charts of the week.
The charts that matter
Gold fell hard this week as rising bond yields stymied demand. Gold doesn’t like rising “real” yields (that is, interest rates adjusted for inflation). Hence the slide.
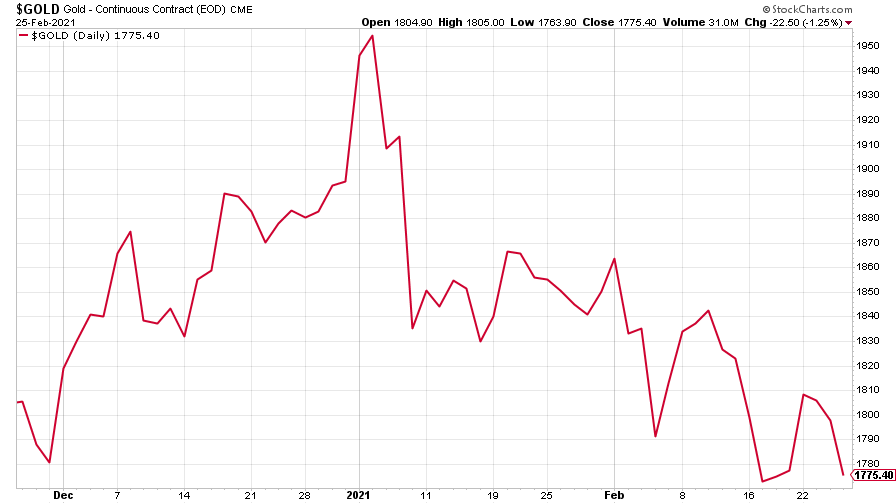
(Gold: three months)
The US dollar index (DXY – a measure of the strength of the dollar against a basket of the currencies of its major trading partners) rose a little over the week, but tailed off towards the end.
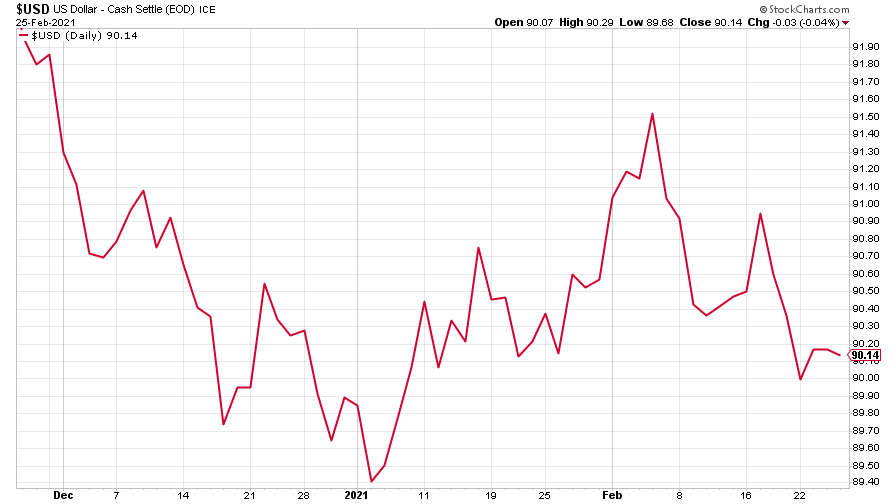
(DXY: three months)
The Chinese yuan (or renminbi) continues to trade in a range against the US dollar (when the red line is falling, the yuan is strengthening).
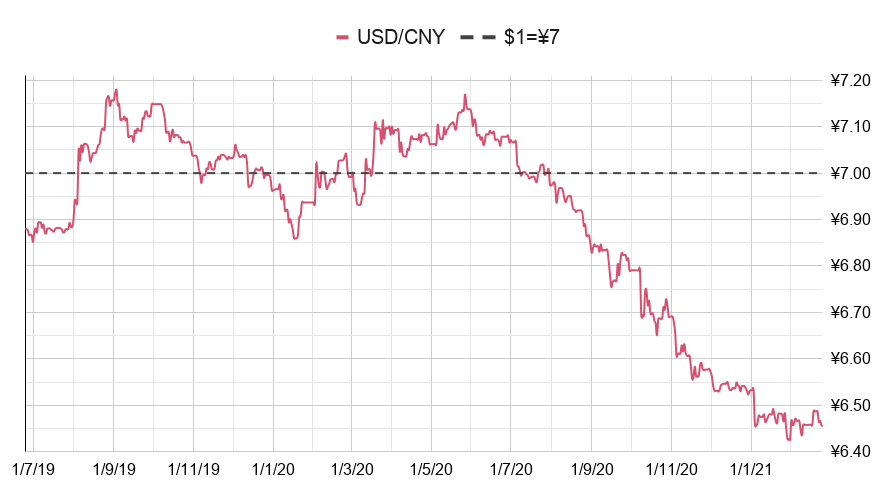
(Chinese yuan to the US dollar: since 25 Jun 2019)
The yield on the ten-year US government bond roared through 1.5% as investors grow increasingly convinced that inflation will force the Federal Reserve to raise rates earlier than expected.
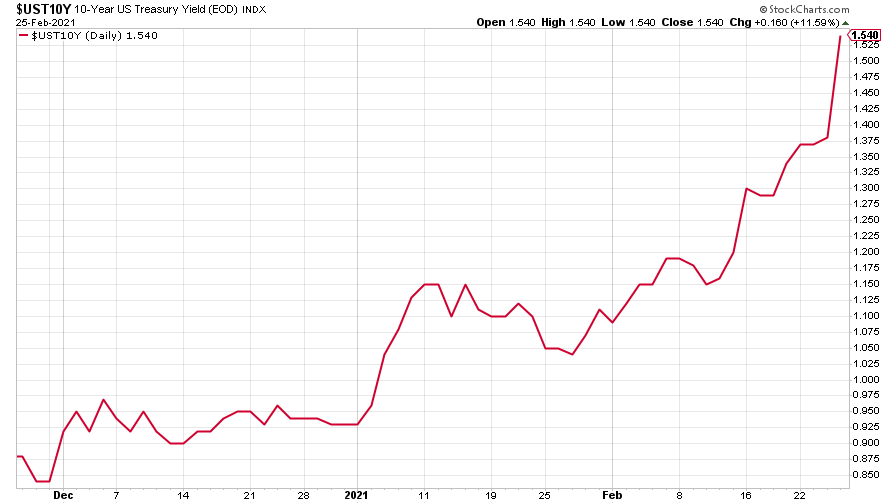
(Ten-year US Treasury yield: three months)
Even the yield on the Japanese ten-year bond saw a steep jump, hitting 0.14% as it tracked other developed-world yields up to hit its highest level since late 2019.
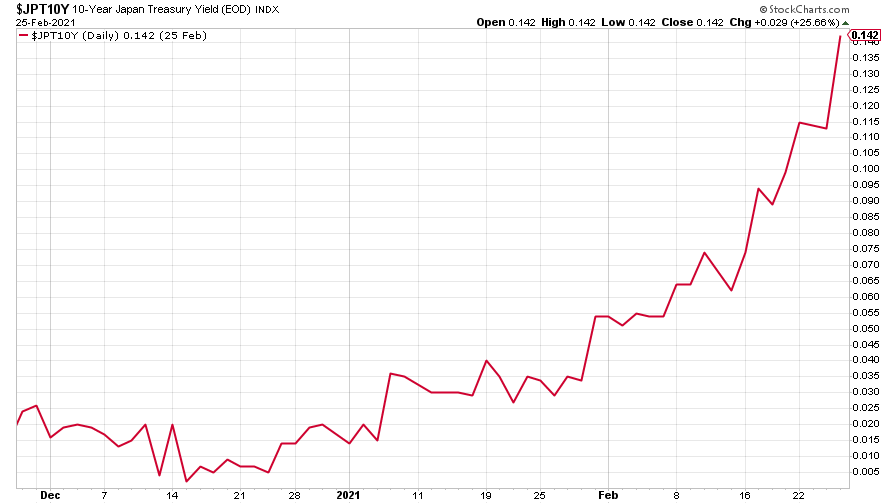
(Ten-year Japanese government bond yield: three months)
The yield on the ten-year German Bund joined the party too, up to levels not seen since early 2020. Still negative, but hurtling towards zero at an astonishing rate.
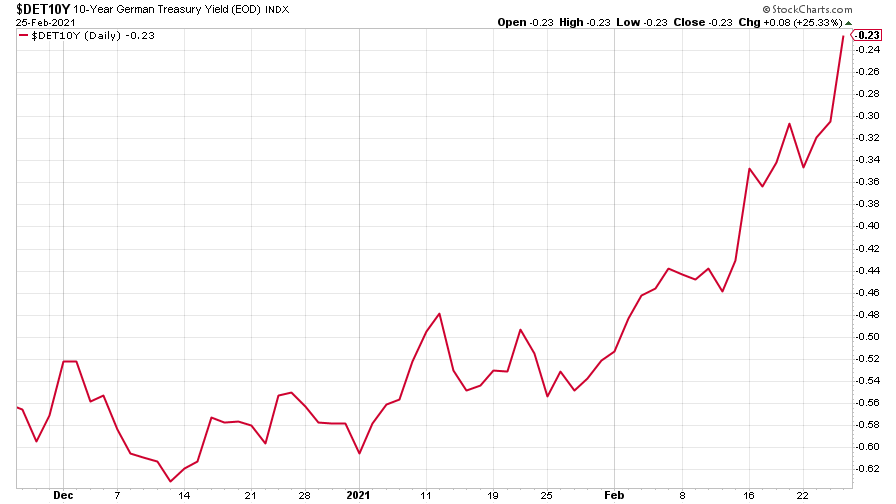
(Ten-year Bund yield: three months)
Copper took another big leap. Find out why this metal is going to be in huge demand in the coming years in this week’s MoneyWeek Podcast.
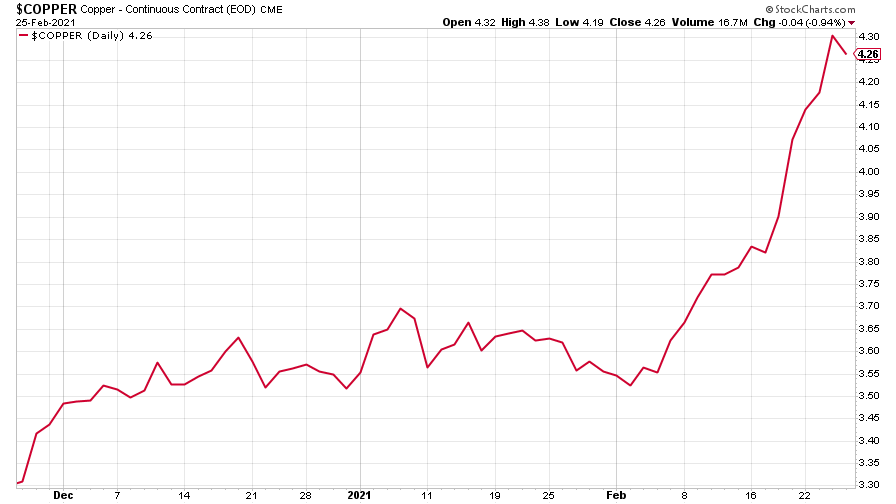
(Copper: nine months)
The Aussie dollar stopped for a breather after another positive week, driven by commodities demand.
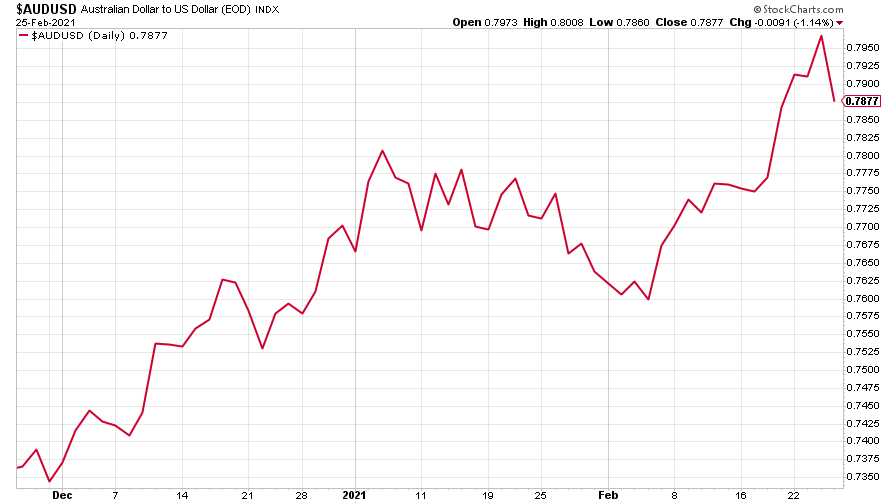
(Aussie dollar vs US dollar exchange rate: three months)
Cryptocurrency bitcoin suffered another of its big crashes after topping $57,000 last week. Loose cannon Elon Musk gave crypto-speculators a fright when he went on Twitter to suggest it was looking a little overvalued. His perhaps ill-judged pronouncement cost him some $15bn.
(By the way, keep an eye out next week for a comprehensive guide to bitcoin put together by our resident crypto-expert Dominic. That’ll be coming your way over the next week or so.)
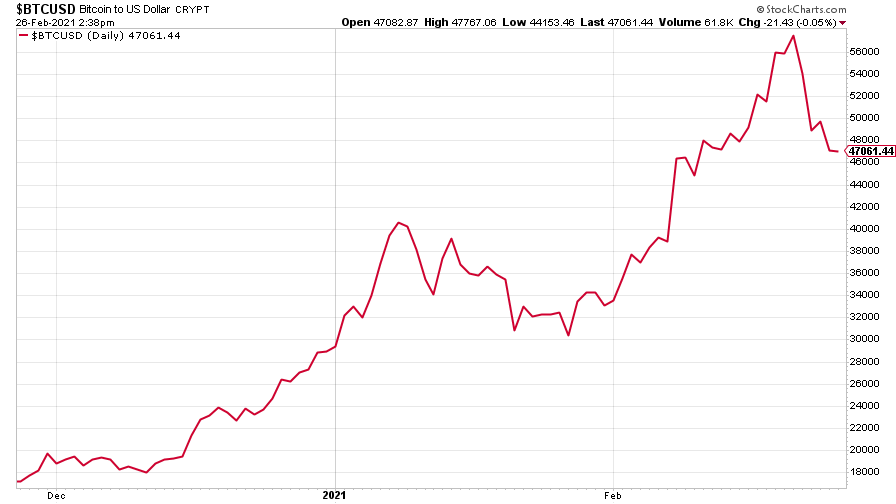
(Bitcoin: three months)
US weekly jobless claims fell by 111,000 to 730,000, compared to 841,000 last week (revised down from 861,000). The four-week moving average fell to 807,750 from 828,250 (which was revised down from 833,250) the week before. It was a bigger fall than many had forecast, suggesting the jobs market could be picking up again.
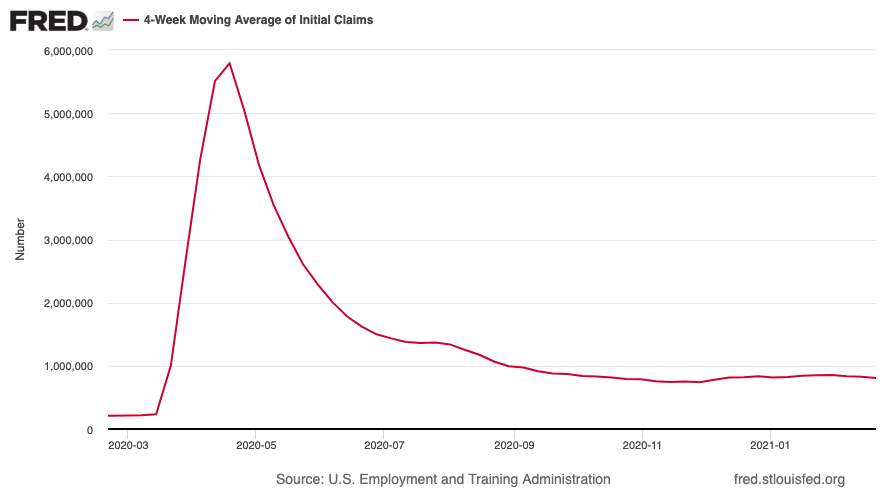
(US jobless claims, four-week moving average: since Jan 2020)
The oil price (as measured by Brent crude) climbed higher still, hitting $66 a barrel. Bank of America is forecasting that oil prices will rise at the fastest rate since the 1970s over the next three years, and could even hit $100 a barrel.
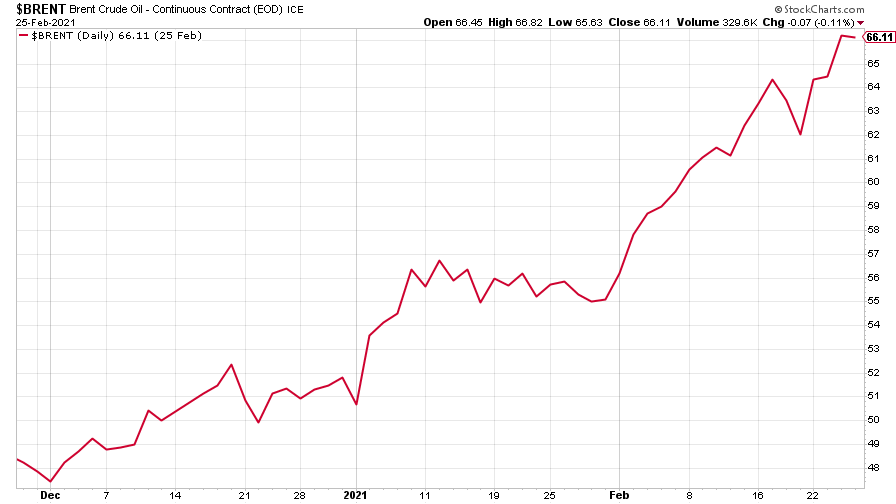
(Brent crude oil: three months)
Amazon took a dive as equities and US tech stocks in particular, sold off heavily.
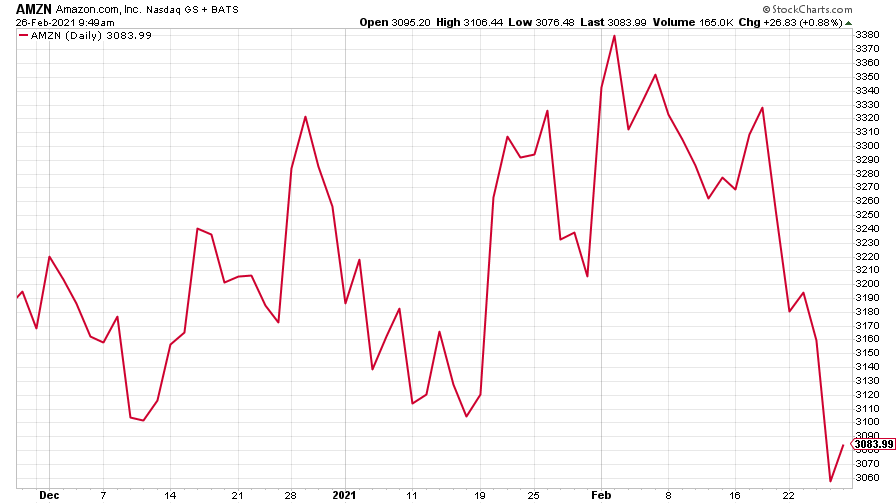
(Amazon: three months)
Tesla joined in the market plunge, not helped by its CEO’s social media activity.
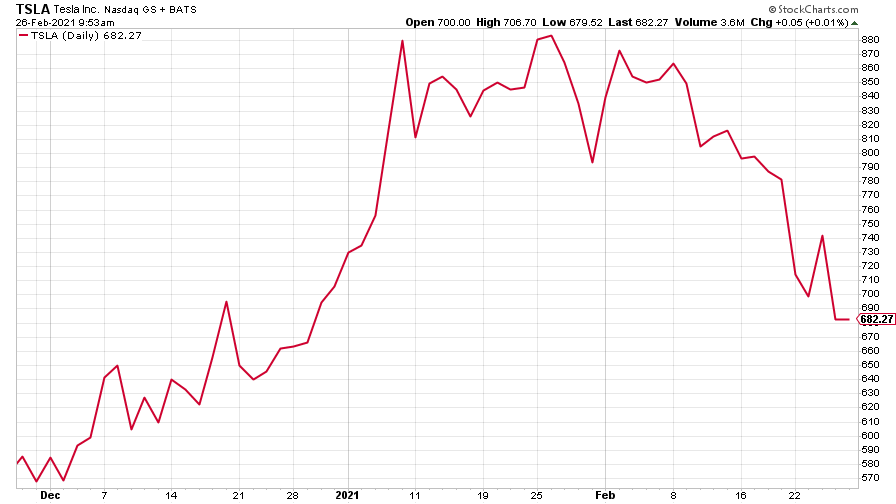
(Tesla: three months)
Have a great weekend.
Get the latest financial news, insights and expert analysis from our award-winning MoneyWeek team, to help you understand what really matters when it comes to your finances.

-
 Average UK house price reaches £300,000 for first time, Halifax says
While the average house price has topped £300k, regional disparities still remain, Halifax finds.
-
 Barings Emerging Europe trust bounces back from Russia woes
Barings Emerging Europe trust has added the Middle East and Africa to its mandate, delivering a strong recovery, says Max King
-
 UK wages grow at a record pace
The latest UK wages data will add pressure on the BoE to push interest rates even higher.
-
 Trapped in a time of zombie government
It’s not just companies that are eking out an existence, says Max King. The state is in the twilight zone too.
-
 America is in deep denial over debt
The downgrade in America’s credit rating was much criticised by the US government, says Alex Rankine. But was it a long time coming?
-
 UK economy avoids stagnation with surprise growth
Gross domestic product increased by 0.2% in the second quarter and by 0.5% in June
-
 Bank of England raises interest rates to 5.25%
The Bank has hiked rates from 5% to 5.25%, marking the 14th increase in a row. We explain what it means for savers and homeowners - and whether more rate rises are on the horizon
-
 UK inflation remains at 8.7% ‒ what it means for your money
Inflation was unmoved at 8.7% in the 12 months to May. What does this ‘sticky’ rate of inflation mean for your money?
-
 Would a food price cap actually work?
Analysis The government is discussing plans to cap the prices of essentials. But could this intervention do more harm than good?
-
 Is my pay keeping up with inflation?
Analysis High inflation means take home pay is being eroded in real terms. An online calculator reveals the pay rise you need to match the rising cost of living - and how much worse off you are without it.
