The charts that matter: markets feeling the second wave wobble
As markets worry about a second wave of Covid-196 infections, John Stepek looks at the charts that matter most to the global economy.

Get the latest financial news, insights and expert analysis from our award-winning MoneyWeek team, to help you understand what really matters when it comes to your finances.
You are now subscribed
Your newsletter sign-up was successful
Want to add more newsletters?

Twice daily
MoneyWeek
Get the latest financial news, insights and expert analysis from our award-winning MoneyWeek team, to help you understand what really matters when it comes to your finances.

Four times a week
Look After My Bills
Sign up to our free money-saving newsletter, filled with the latest news and expert advice to help you find the best tips and deals for managing your bills. Start saving today!
Welcome back. Don’t miss Merryn’s latest podcast with Nick Greenwood of Premier Miton Investors. Nick’s always good to listen to – I’m a fan of investment trusts and he never fails to tell us about some of the most interesting and even obscure opportunities out there. Give it a listen here.
And if you like investment trusts, make sure you read Max King’s latest piece in this week’s issue of MoneyWeek, where he looks at the prospects for private equity and the best trusts in the sector right now. If you’re not already a subscriber of course, you can pick up your first six issues for free right here.
Here are the links for this week’s editions of Money Morning.
MoneyWeek
Subscribe to MoneyWeek today and get your first six magazine issues absolutely FREE

Sign up to Money Morning
Don't miss the latest investment and personal finances news, market analysis, plus money-saving tips with our free twice-daily newsletter
Don't miss the latest investment and personal finances news, market analysis, plus money-saving tips with our free twice-daily newsletter
- Monday:Fund managers are feeling neurotic – that’s probably a good sign
- Tuesday:Three key lessons investors can learn from the Wirecard disaster
- Merryn’s blog: Why it can pay to keep your investments in the family
- Wednesday: What’s a better bet right now: a house in the UK or gold?
- Thursday: Is the pound really turning into an emerging-market currency?
- Friday: When everyone hates an asset class, it’s usually a good time to buy
(On that last Money Morning, if you’re interested in contrarian investing, check out my book, The Sceptical Investor – you can get it on audio here, or print/ebook here.)
On to the charts of the week.
The charts that matter
This week, we got a dose of the “second wave wibbles” – that’s the technical term (well, it’s my technical term) for the mounting concern that Covid-19 is going to bounce back as lockdowns become less stringent. There’s no doubt that case numbers are rising, particularly in certain US states, where lockdown has been even more politicised than it has elsewhere.
This is a worry for lots of reasons. Putting individual health concerns to one side, there are two key issues.
One is whether the easing of lockdowns is actually reversed or not. That in turn will depend on a) case numbers; b) how healthcare systems cope (remember that lockdown was originally pitched as being designed to avoid overwhelming the emergency services, not as a way to avoid any cases at all); and c) politics – in the US specifically (and it is the world’s biggest economy), it’s hard to see Donald Trump giving the nod to anything that would jeopardise his already shaky chances in November’s presidential vote.
The second factor is a derivative of the first: what effect does this have on confidence? Even if there is no further lockdown, what if people decide they’re too scared to come out? I tend to think that the answer to this is that as long as people have jobs, or even a steady stream of income, then there’s probably enough genuinely “pent-up” demand to see us through a fair few months.
After that? The longer it drags on for, the greater the damage. But again, the length of time it drags on for probably depends on just how virulent any second wave is.
So you can see why the market might be feeling nervy. It’s pretty hard to come down on one side or another in terms of where this is going to go in the near term. So let’s look at how that played out in the charts.
Gold had a decent week. Central bank money printing is bullish for gold. But so is a desire to park money in a “safe haven” asset. So overall, the yellow metal benefited from the “risk-off” undertones this week.
Note though that on a purely technical level, it’s likely that gold will have a fight on its hands overcoming that $1,800 – $1,900 area (its previous US dollar high was just above $1,900).
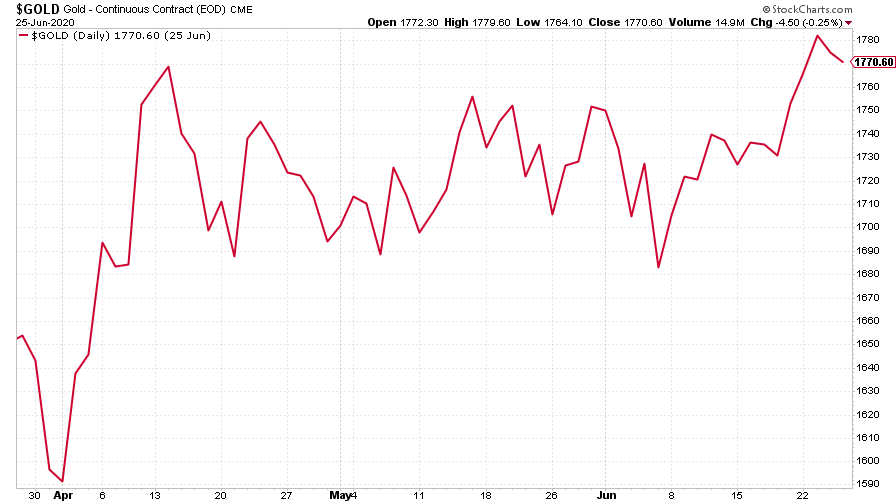
(Gold: three months)
The US dollar index (DXY – a measure of the strength of the dollar against a basket of the currencies of its major trading partners) by contrast, has had a tougher time, again hinting at a market that’s torn between “half-empty” and “half-full”. The US currency started to rebound strongly the week before last, which is an unwelcome development from a bull’s perspective, but it had fallen quite consistently for a few weeks, so was probably due a bounce. Its struggle to continue higher is a good sign for the “risk-on” contingent, for now at least.
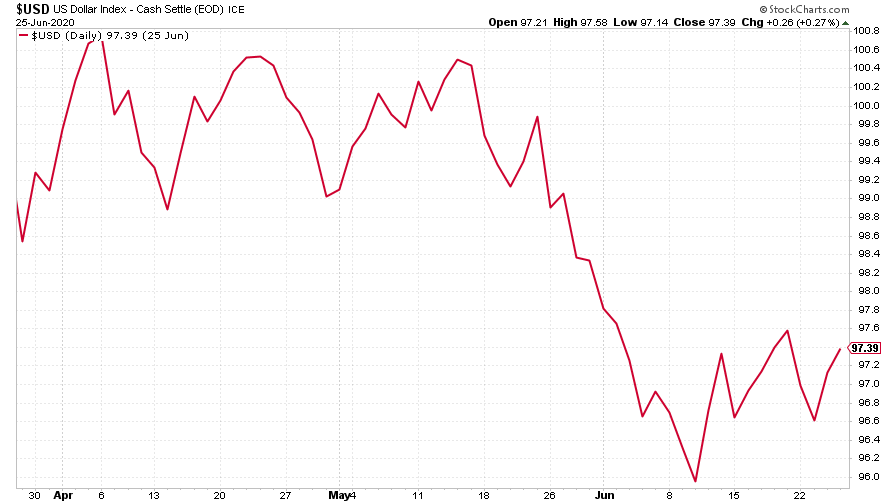
(DXY: three months)
The Chinese yuan (or renminbi) was little moved against the dollar, which is no surprise given that US-China tensions are currently on the backburner as far as markets are concerned (it’ll all kick off again at some point, rest assured).
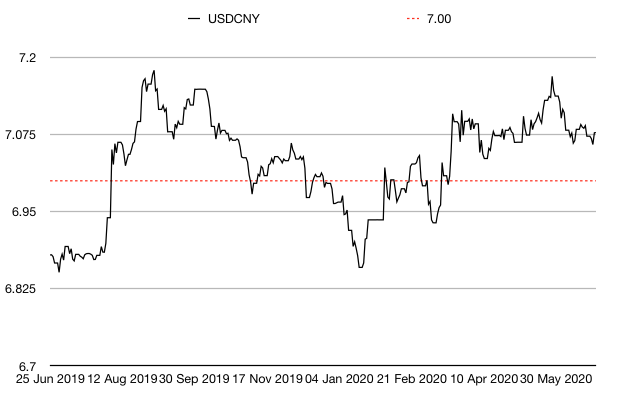
(Chinese yuan to the US dollar: since 25 Jun 2019)
The yield on the ten-year US government bond did continue lower, which again points to safe haven buying.
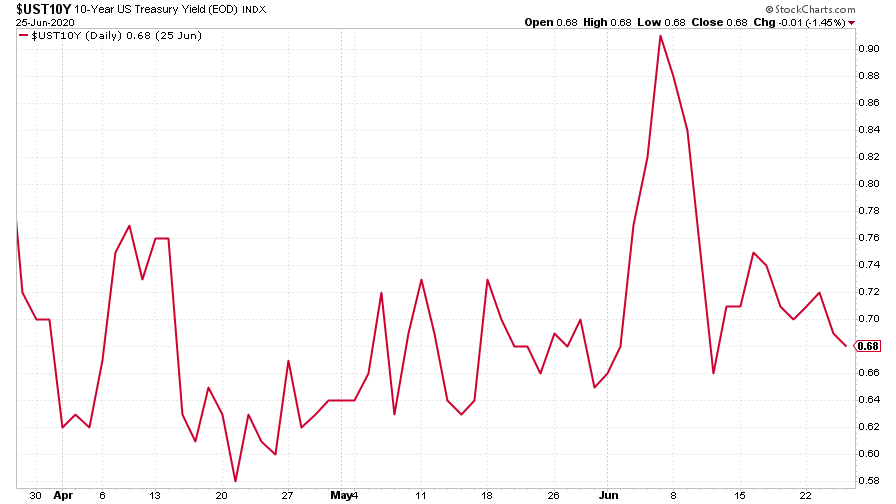
(Ten-year US Treasury yield: three months)
The yield on the Japanese ten-year was little changed (this looks like a big move on the chart but check the scale – in the last three months, the yield on this bond has hit a low of -0.045% and a high of just above 0.04%). That’s basically static, a move of less than ten basis points (ie 0.1 percentage points).
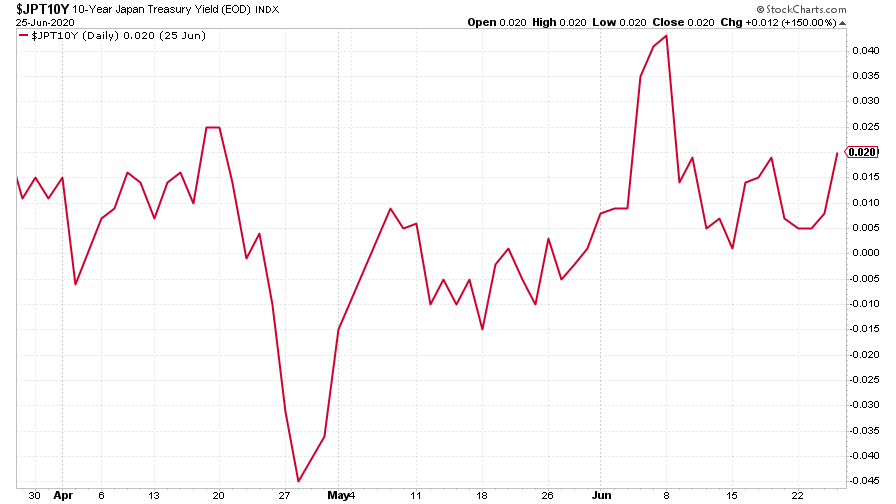
(Ten-year Japanese government bond yield: three months)
The yield on the ten-year German bund meanwhile, fell a bit lower.
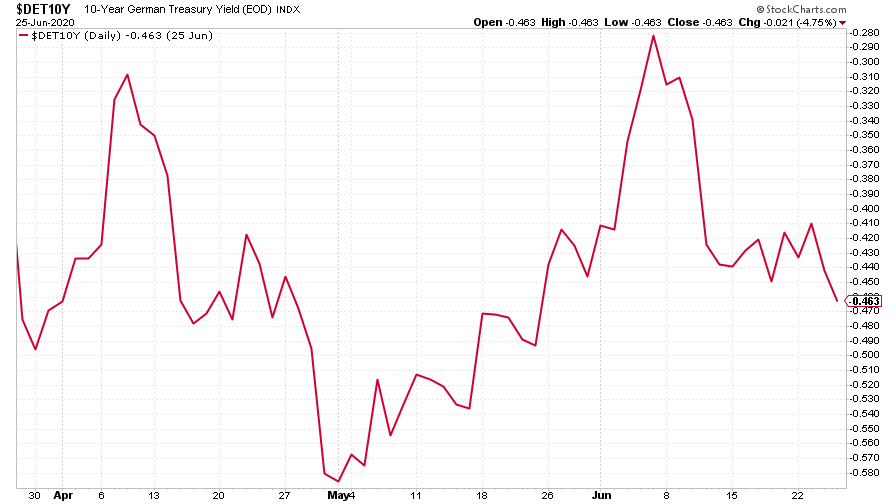
(Ten-year Bund yield: three months)
Copper continues to be the indicator that the bulls should be rooting for. As long as copper is rallying it suggests that the economy is using more raw materials, and therefore that the idea we’re in for a better-than-expected rebound might have legs.
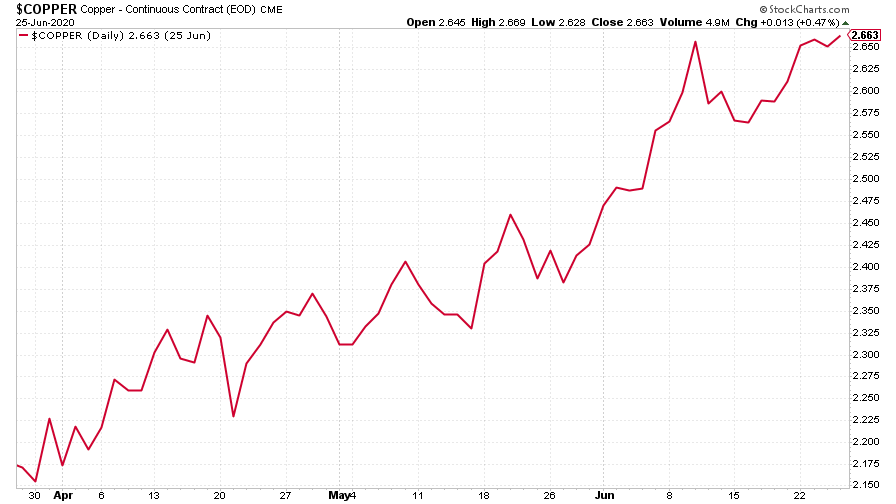
(Copper: three months)
The Aussie dollar was little changed this week, partly reflecting the dollar’s uncertain mood.
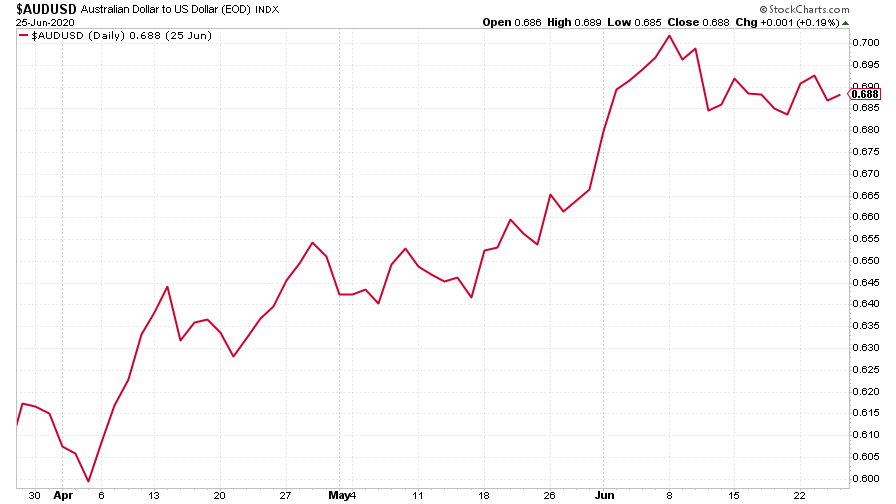
(Aussie dollar vs US dollar exchange rate: three months)
Cryptocurrency bitcoin has been so becalmed in recent months that I’ve decided we can start looking at it on a three-month basis, given that we haven’t really seen any significant volatility from it since early May. I’m still not sure what that means, if anything, but I think it’s still worth keeping an eye on the original digital cash.
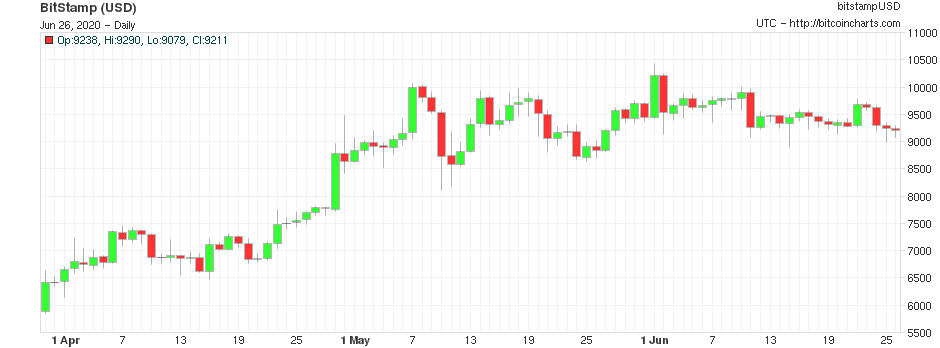
(Bitcoin: three months)
This week’s US weekly jobless claims figure was little changed on last week, and was worse than expected. The number of new claims fell to 1.48 million (down from 1.51 million last week). Economists had expected the figure to come in at 1.3 million. The four-week moving average now sits at 1.62 million, compared to last week’s 1.77 million.
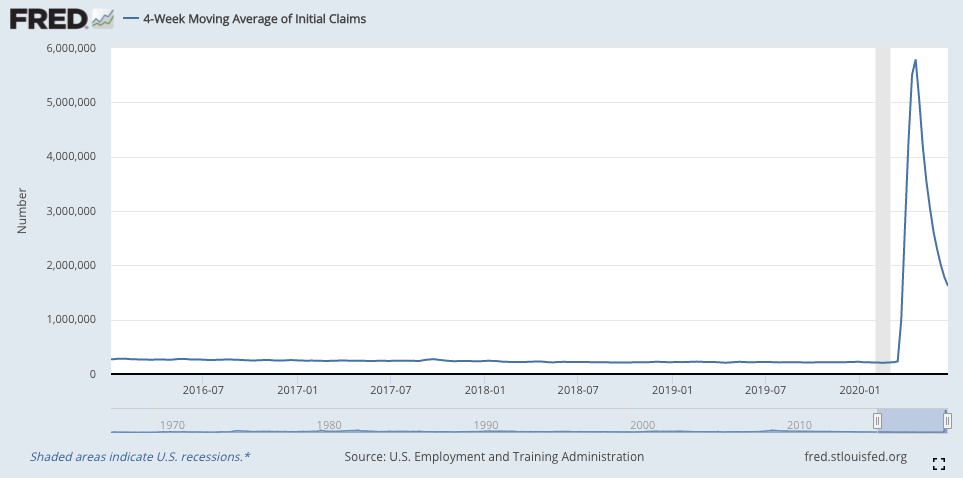
(US jobless claims, four-week moving average: since January 2016)
The oil price couldn’t muster the energy for another run higher although it has enjoyed a solid recovery from its negative-pricing nadir.
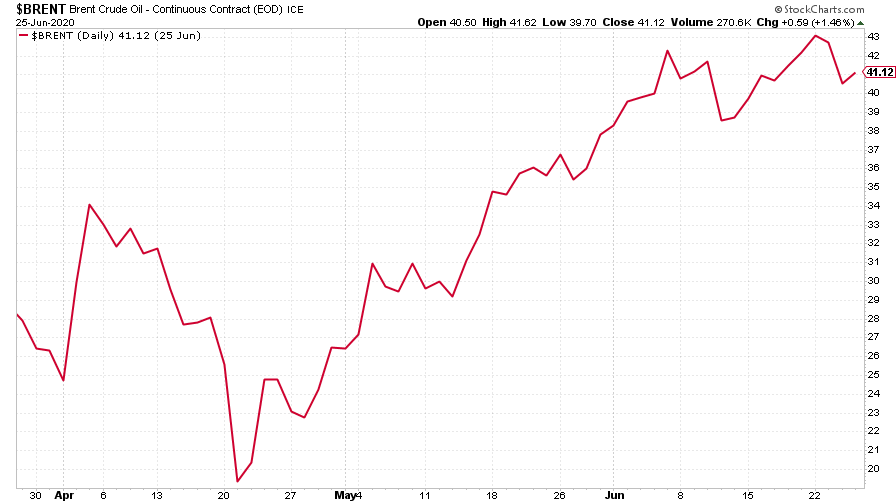
(Brent crude oil: three months)
Amazon had a good week, as big tech stocks – which are deemed the safest stocks to own right now, for a wide range of reasons, a lot of them relating to “safety in numbers” (you won’t get fired for owning the same stock all your fellow fund managers own) – rallied.
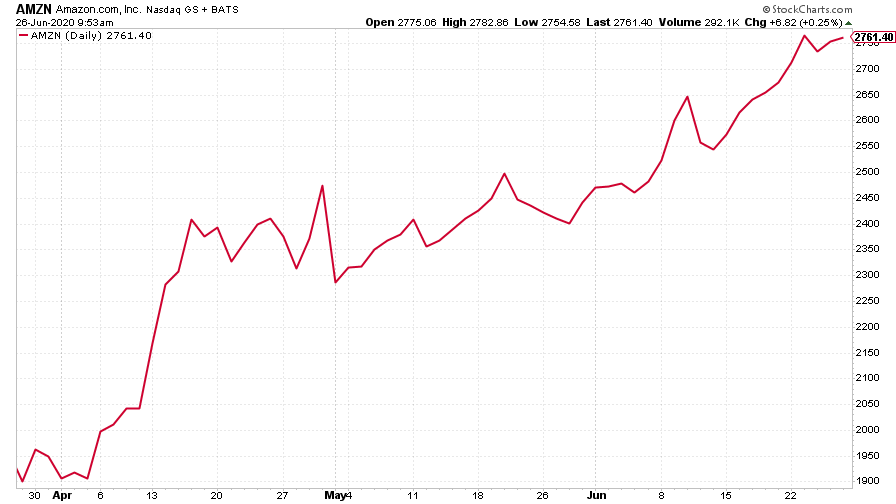
(Amazon: three months)
Electric car group Tesla wasn’t quite as exuberant as in recent weeks, although it has enjoyed an extraordinary run.
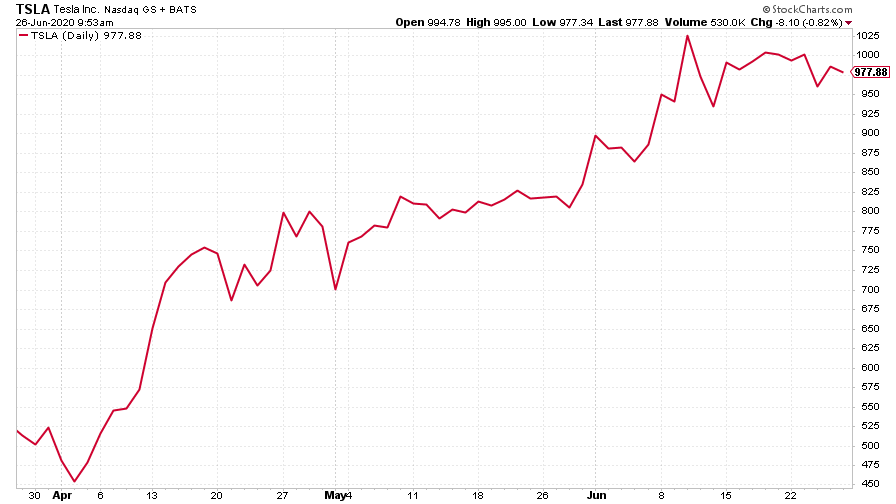
(Tesla: three months)
Get the latest financial news, insights and expert analysis from our award-winning MoneyWeek team, to help you understand what really matters when it comes to your finances.

-
 Can mining stocks deliver golden gains?
With gold and silver prices having outperformed the stock markets last year, mining stocks can be an effective, if volatile, means of gaining exposure
-
 8 ways the ‘sandwich generation’ can protect wealth
People squeezed between caring for ageing parents and adult children or younger grandchildren – known as the ‘sandwich generation’ – are at risk of neglecting their own financial planning. Here’s how to protect yourself and your loved ones’ wealth.
-
 What's behind the big shift in Japanese government bonds?
Rising long-term Japanese government bond yields point to growing nervousness about the future – and not just inflation
-
 UK wages grow at a record pace
The latest UK wages data will add pressure on the BoE to push interest rates even higher.
-
 Trapped in a time of zombie government
It’s not just companies that are eking out an existence, says Max King. The state is in the twilight zone too.
-
 America is in deep denial over debt
The downgrade in America’s credit rating was much criticised by the US government, says Alex Rankine. But was it a long time coming?
-
 UK economy avoids stagnation with surprise growth
Gross domestic product increased by 0.2% in the second quarter and by 0.5% in June
-
 Bank of England raises interest rates to 5.25%
The Bank has hiked rates from 5% to 5.25%, marking the 14th increase in a row. We explain what it means for savers and homeowners - and whether more rate rises are on the horizon
-
 UK inflation remains at 8.7% ‒ what it means for your money
Inflation was unmoved at 8.7% in the 12 months to May. What does this ‘sticky’ rate of inflation mean for your money?
-
 Would a food price cap actually work?
Analysis The government is discussing plans to cap the prices of essentials. But could this intervention do more harm than good?