The charts that matter: the US and China – the calm before the storm?
John Stepek looks at how the rising tension between the US and China over Hong Kong has affected the charts that matter the most to the global economy.

Get the latest financial news, insights and expert analysis from our award-winning MoneyWeek team, to help you understand what really matters when it comes to your finances.
You are now subscribed
Your newsletter sign-up was successful
Want to add more newsletters?

Twice daily
MoneyWeek
Get the latest financial news, insights and expert analysis from our award-winning MoneyWeek team, to help you understand what really matters when it comes to your finances.

Four times a week
Look After My Bills
Sign up to our free money-saving newsletter, filled with the latest news and expert advice to help you find the best tips and deals for managing your bills. Start saving today!
Welcome back. We’re now officially into MoneyWeek’s second millennium – issue 1,001 came out yesterday. Sign up now if you’re not already a subscriber.
Here are the links for this week’s editions of Money Morning.
- Monday (Sceptical Investor extract): How John Maynard Keynes learned the folly of market timing
- Tuesday (Sceptical Investor extract): Are you a permabear? Three red flags to watch out for
- Wednesday: Governments’ money-printing mania bodes well for base metals
- Thursday: Here’s why investors should care about the EU’s plan to tackle Covid-19
- Friday: As full lockdown ends, what are the risks for investors?
Oh and don’t miss Merryn’s controversial column – In support of active fund management. Judging by the reaction to the headline alone, this is now a genuinely unpopular view.
MoneyWeek
Subscribe to MoneyWeek today and get your first six magazine issues absolutely FREE

Sign up to Money Morning
Don't miss the latest investment and personal finances news, market analysis, plus money-saving tips with our free twice-daily newsletter
Don't miss the latest investment and personal finances news, market analysis, plus money-saving tips with our free twice-daily newsletter
Which should, of course, have anyone of a contrarian bent thinking a little harder about the impact of passive investing on wider market structure (I’ll be writing about this for MoneyWeek in the very near future) and whether or not it makes sense to take too doctrinaire a view on the active vs passive debate. Maybe – say it ain’t so! – there’s room for both in your portfolio.
And don’t miss this week’s podcast with James Ferguson, one of our favourite writers and thinkers. James talks about the flaws in the lockdown – and perhaps more importantly, he talks about how inflation could come about as a result of the government’s efforts to prevent permanent damage to the economy.
And now on to today’s charts of the week.
The charts that matter
Gold (measured in dollar terms) had another solid week. It was helped both by geopolitical jitters and a somewhat weaker US dollar.
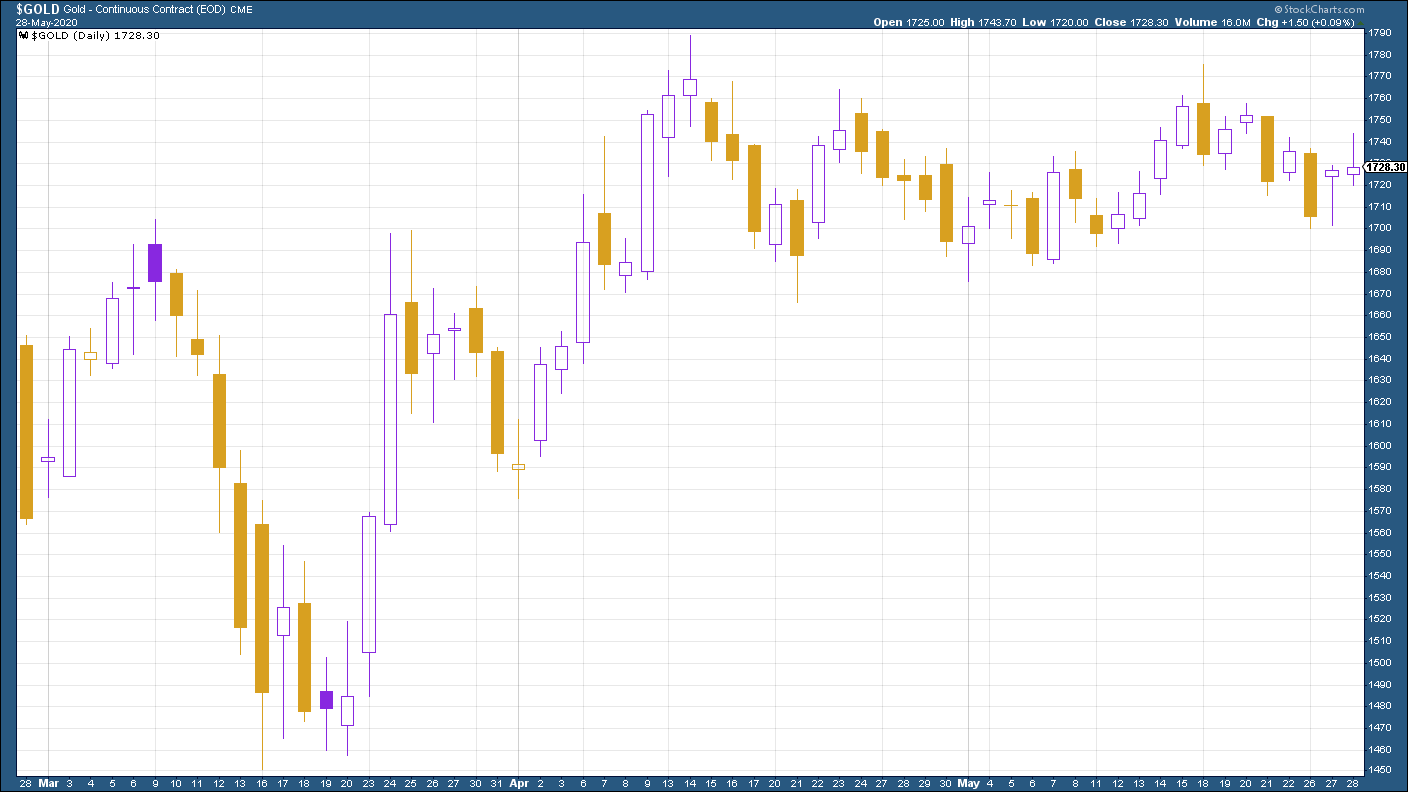
(Gold: three months)
The US dollar index (a measure of the strength of the dollar against a basket of the currencies of its major trading partners) dipped sharply this week. That was driven mainly by market hopes that the eurozone has now effectively agreed to share debt, which in turn means the chances of a messy break up (for now at least) have diminished drastically. You can read more about that in Thursday’s email.
Anyway, as a result the euro strengthened against the US dollar, which pushed the index down (the euro is the biggest component of the index).
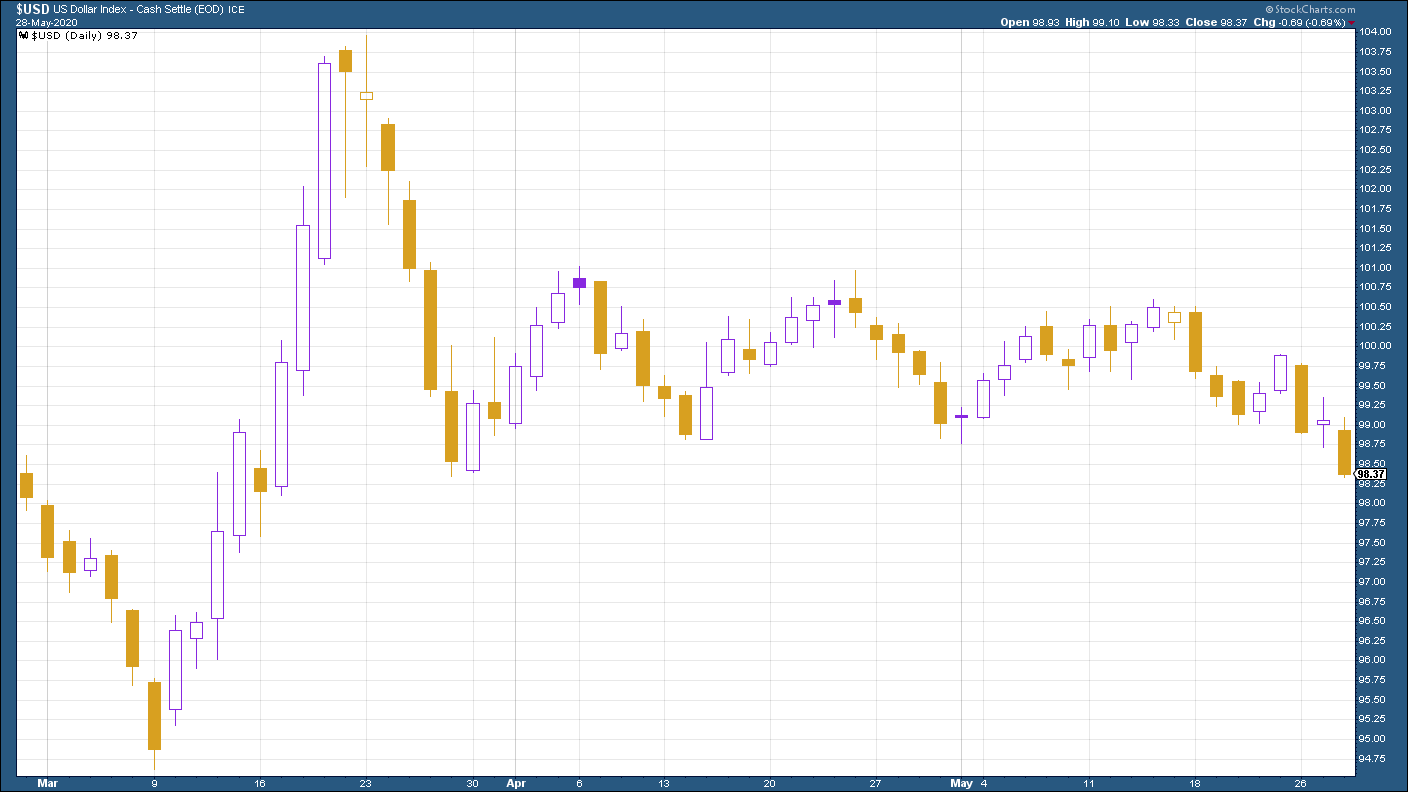
(DXY: three months)
The most obvious indicator of the rising tension between the US and China over Hong Kong (or rather, over everything, but with Hong Kong as the catalyst) was the steady weakening of the Chinese yuan (or renminbi) against the US dollar. The yuan hasn’t quite hit the record seen in mid-2019 but it’s likely to get there next week and it’ll be interesting to see how markets cope with that.
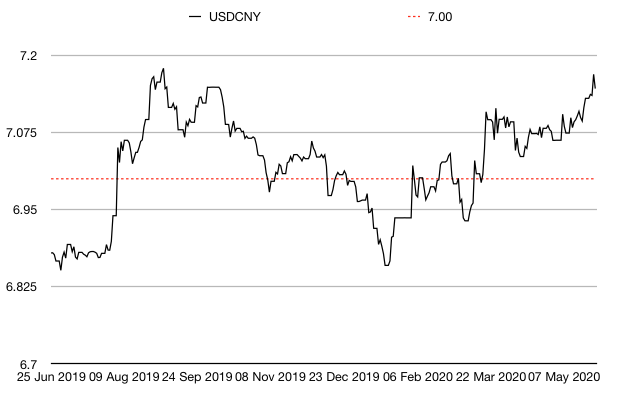
(Chinese yuan to the US dollar: since 25 Jun 2019)
The yield on the ten-year US government bond edged a little higher again this week.
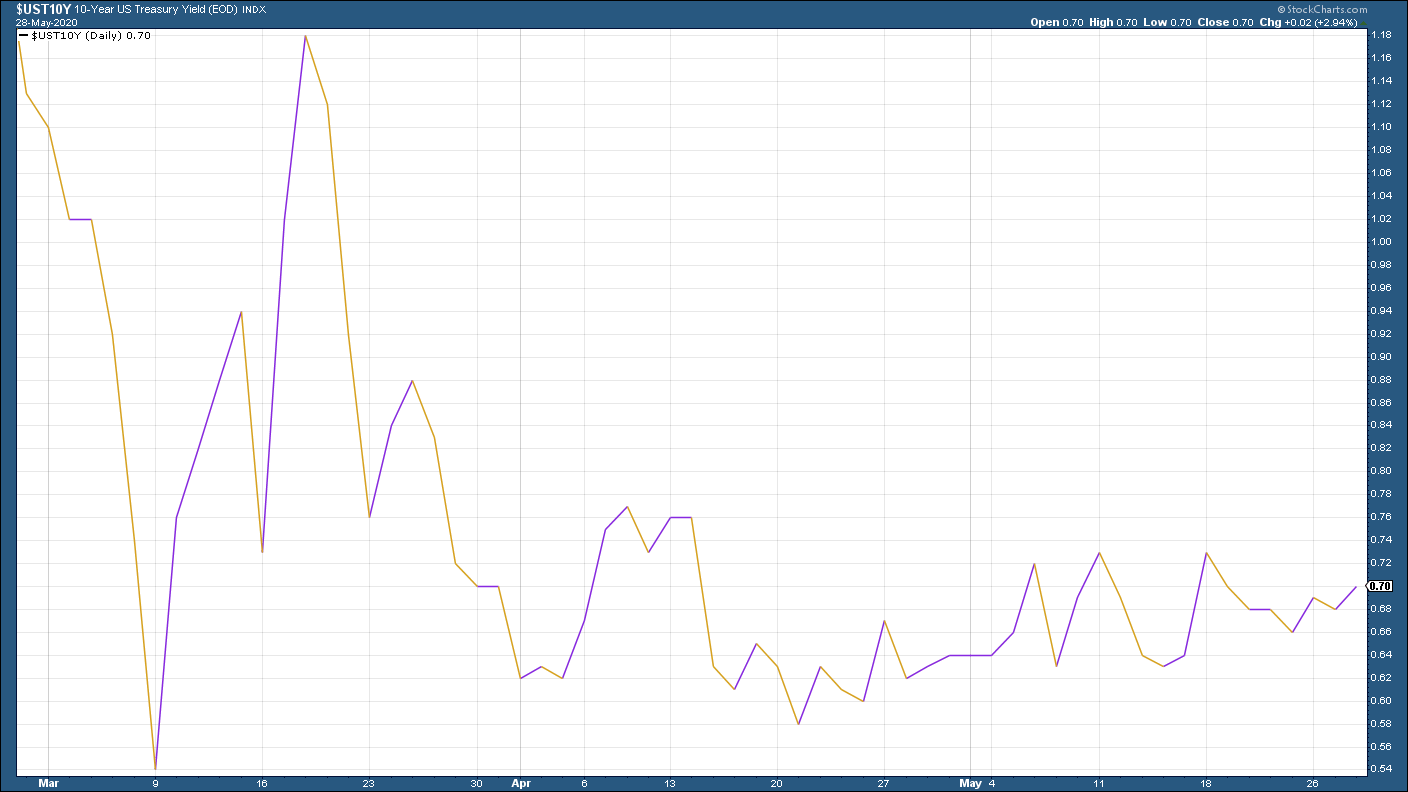
(Ten-year US Treasury yield: three months)
The yield on the Japanese ten-year was almost entirely unchanged all week.
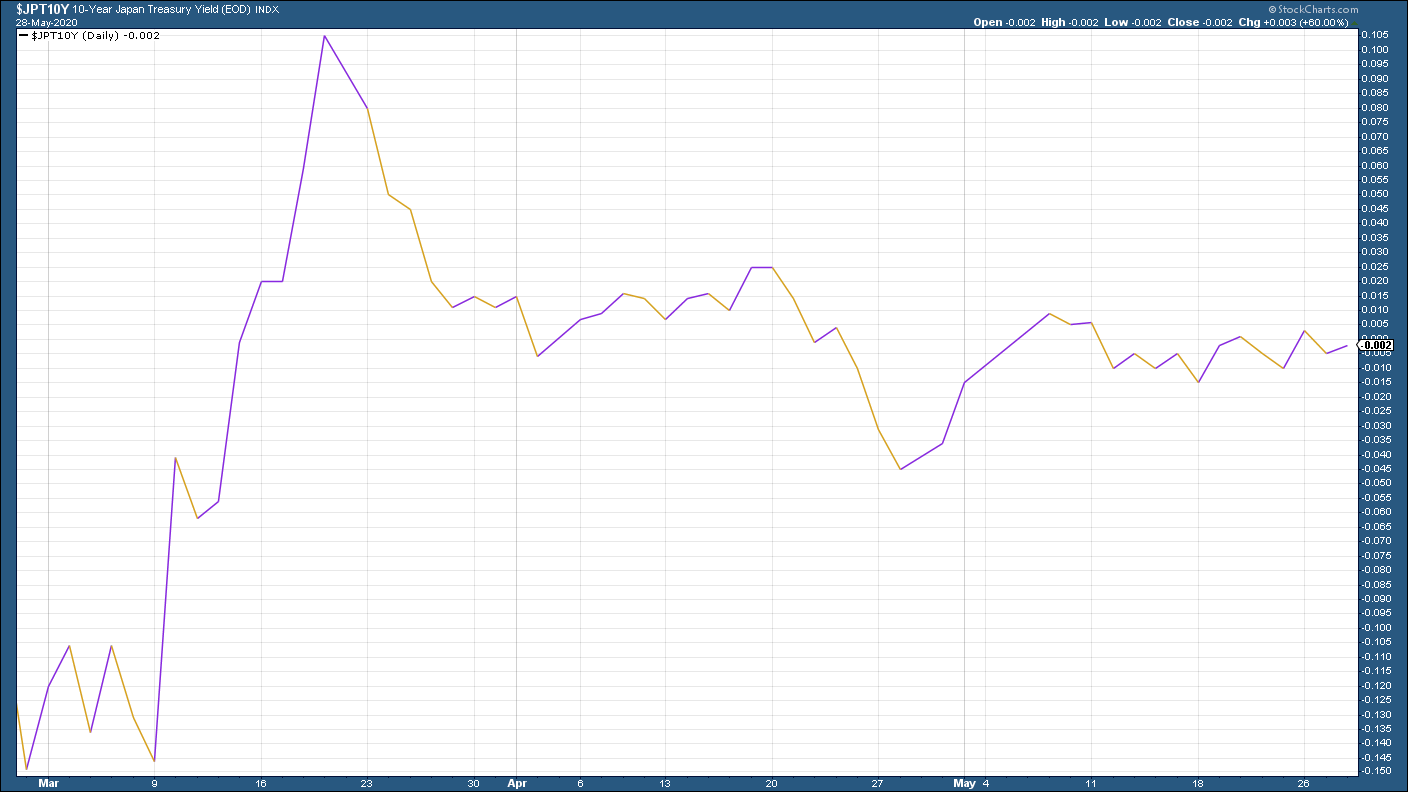
(Ten-year Japanese government bond yield: three months)
The yield on the ten-year German bund headed higher as the eurozone edged closer to a genuine deal on debt-sharing. That means the gap between German debt (the safest eurozone debt) and that of riskier debt, eg Italy, should start to converge again.
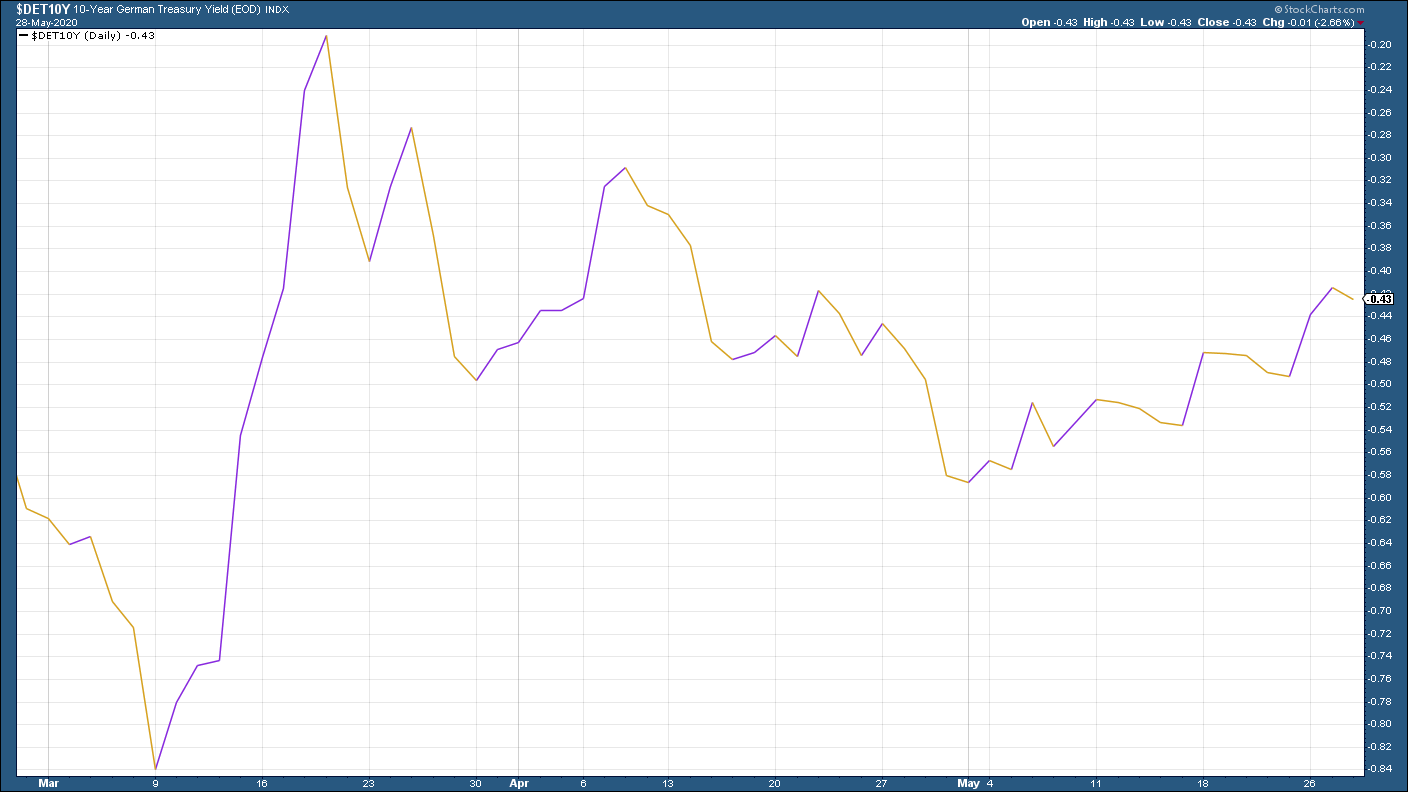
(Ten-year Bund yield: three months)
Copper took a breather this week (as did oil – see below), showing more concern over the potential impact of any heightening of tensions between China and the US than some other assets.
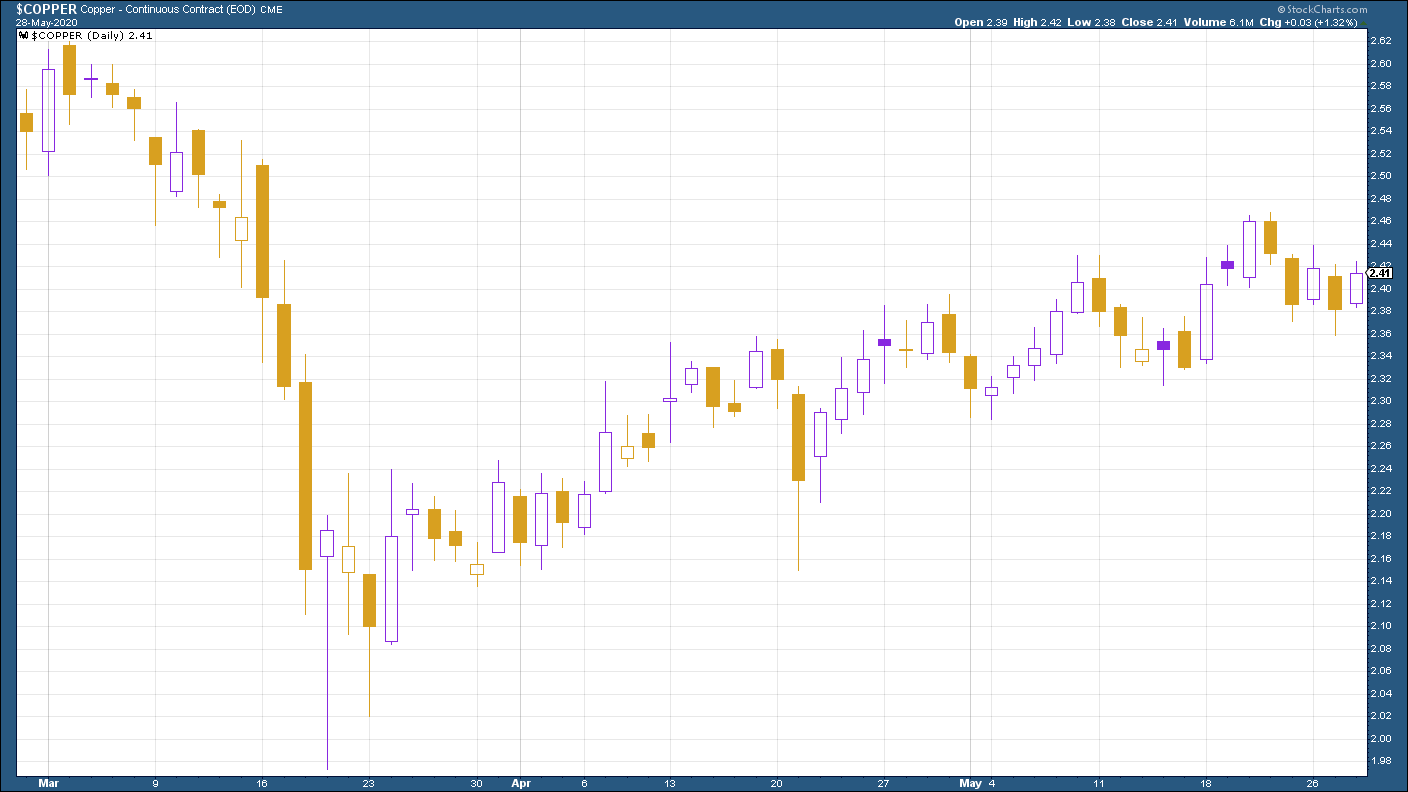
(Copper: three months)
For example, the Aussie dollar continued to push higher this week partly driven by the weaker US dollar outweighing concerns over worsening US-China relations for the time being at least.
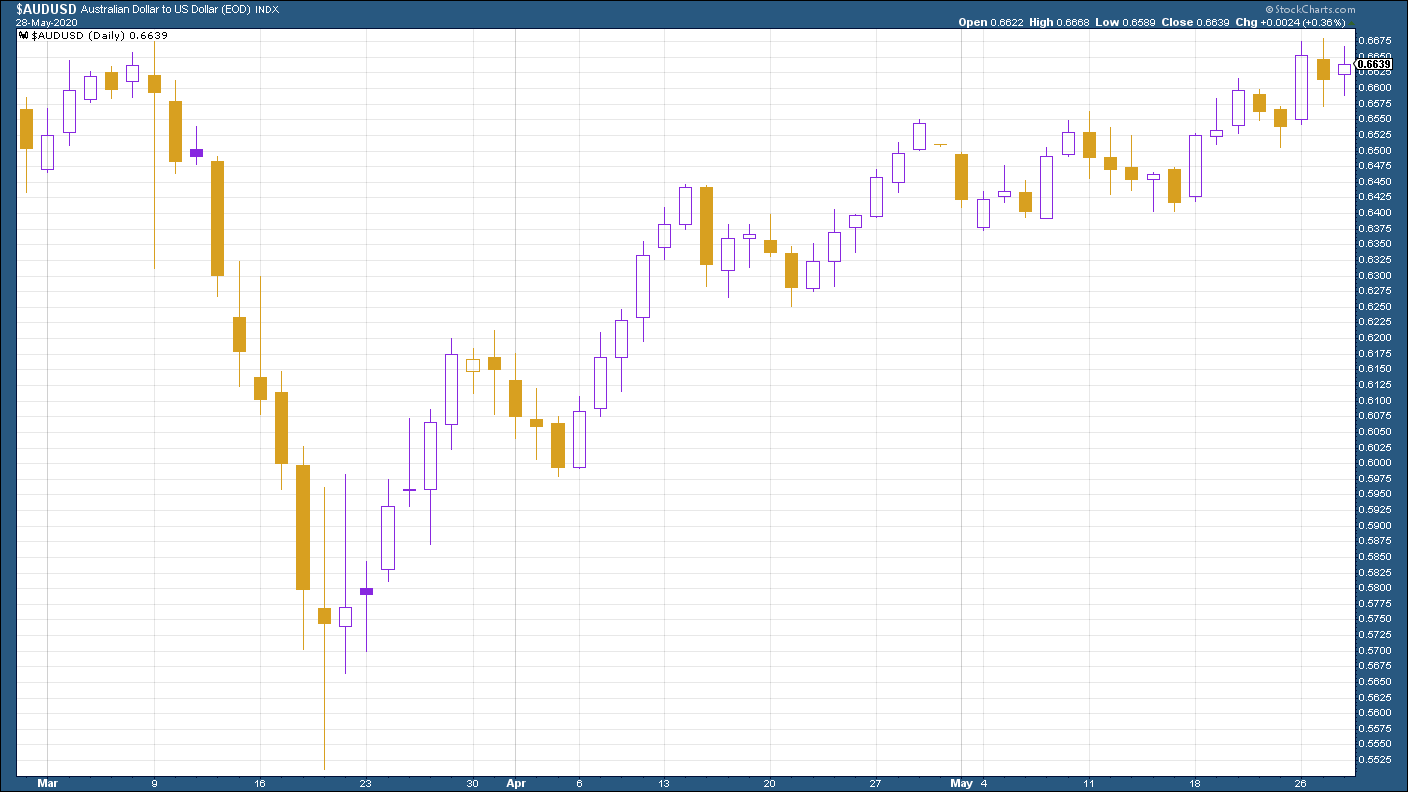
(Aussie dollar vs US dollar exchange rate: three months)
Cryptocurrency bitcoin continues to trade in a range, with no obvious big picture economic reasons as to why and when it moves.
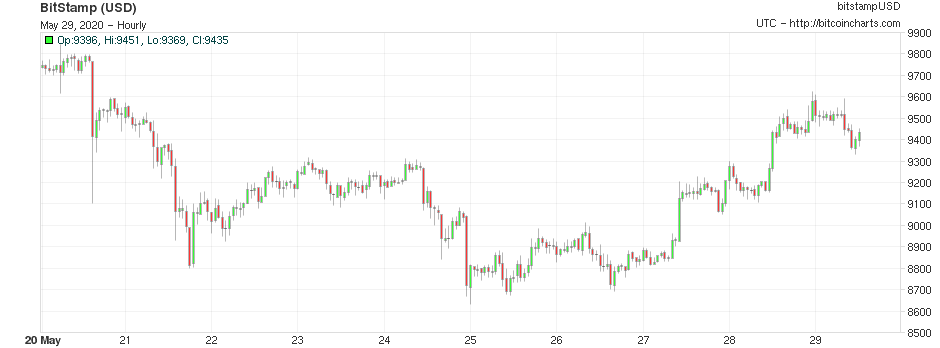
(Bitcoin: ten days)
This week’s US weekly jobless claims figure of 2.1 million (down from 2.4 million last week) brought the total number of pandemic-related first-time applications for jobless benefits to more than 40 million. The four-week moving average now sits at 2.61 million, compared to last week’s 3.04 million.
However, continuing claims – in other words, people still receiving jobless payments after at least two weeks – fell for the first time since February, which is good news inasmuch as anything about these figures is good – it means at least some people are getting back to work.
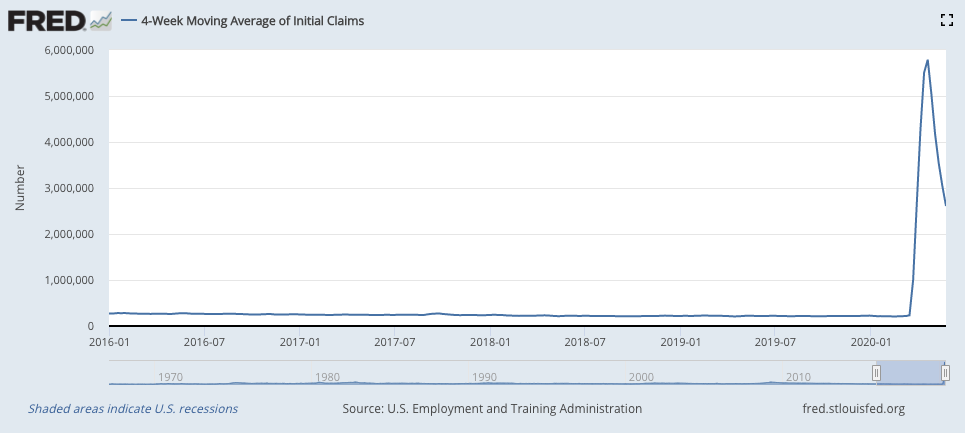
(US jobless claims, four-week moving average: since January 2016)
The oil price rally took a breather after a strong run. Investors may now have decided that demand isn’t entirely going to vanish, but they might need some more convincing that supply is adjusting rapidly enough.
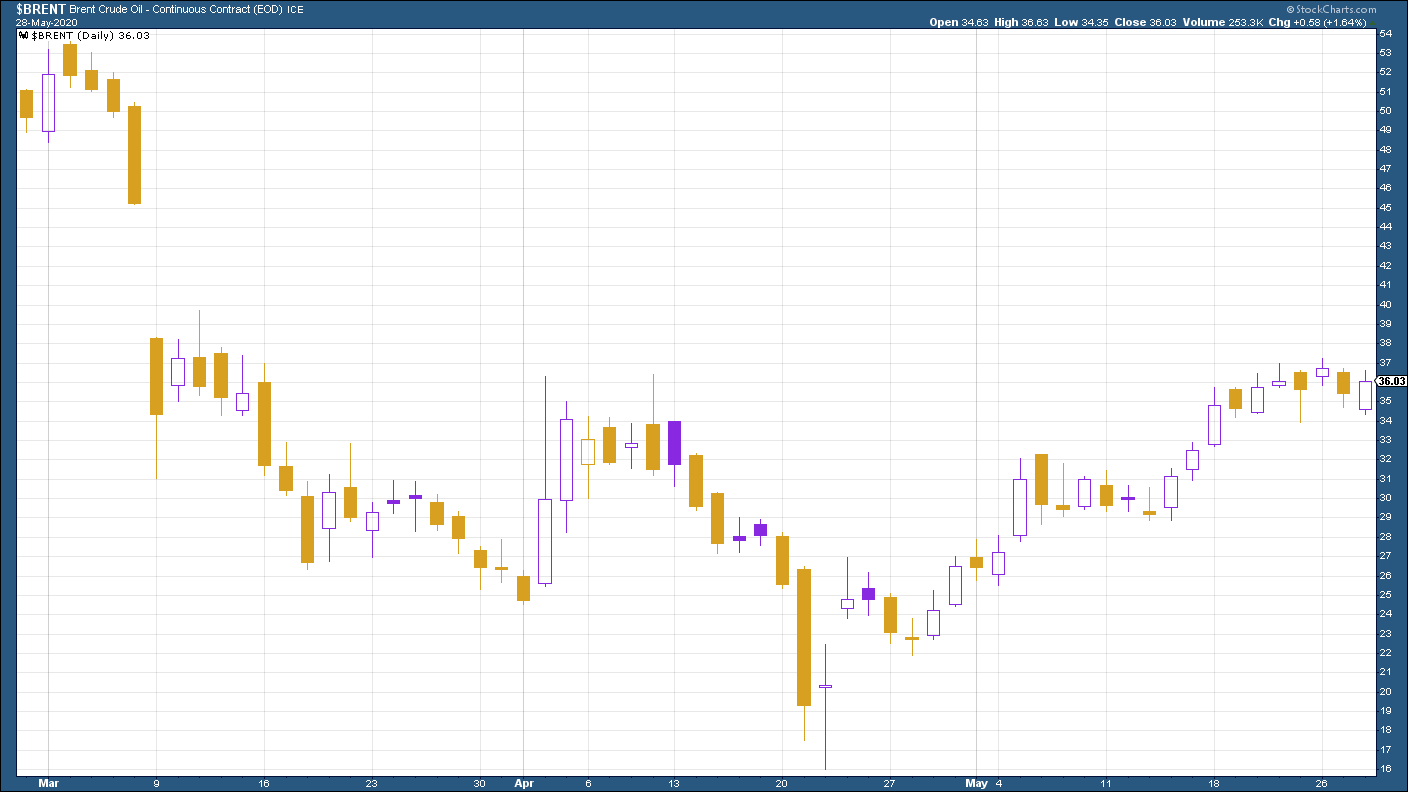
(Brent crude oil: three months)
Amazon shares were a little lower on the week as markets took a knock late in the week on US-China nerves.
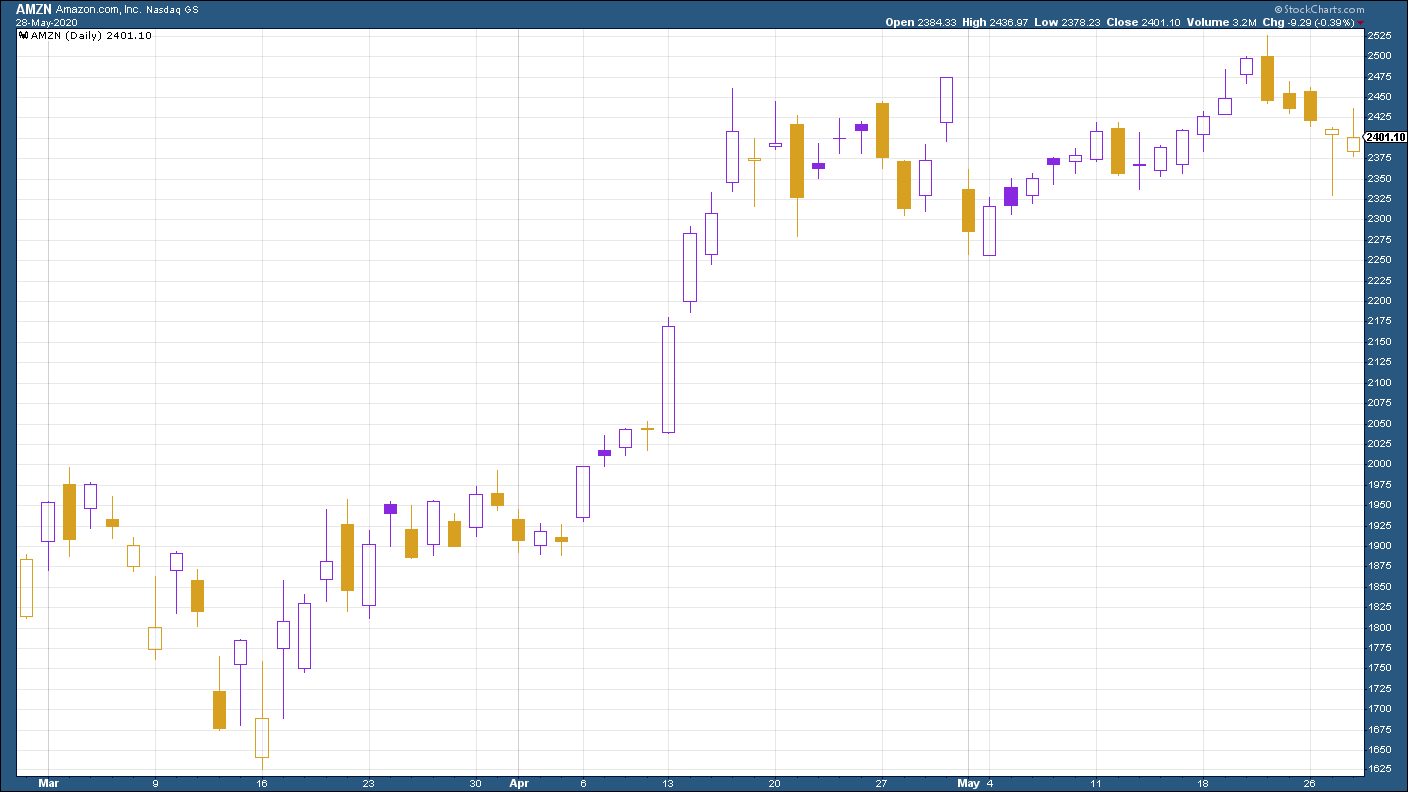
(Amazon: three months)
It was a similar story for electric car group Tesla, the new favourite stock of today’s day-trading generation.
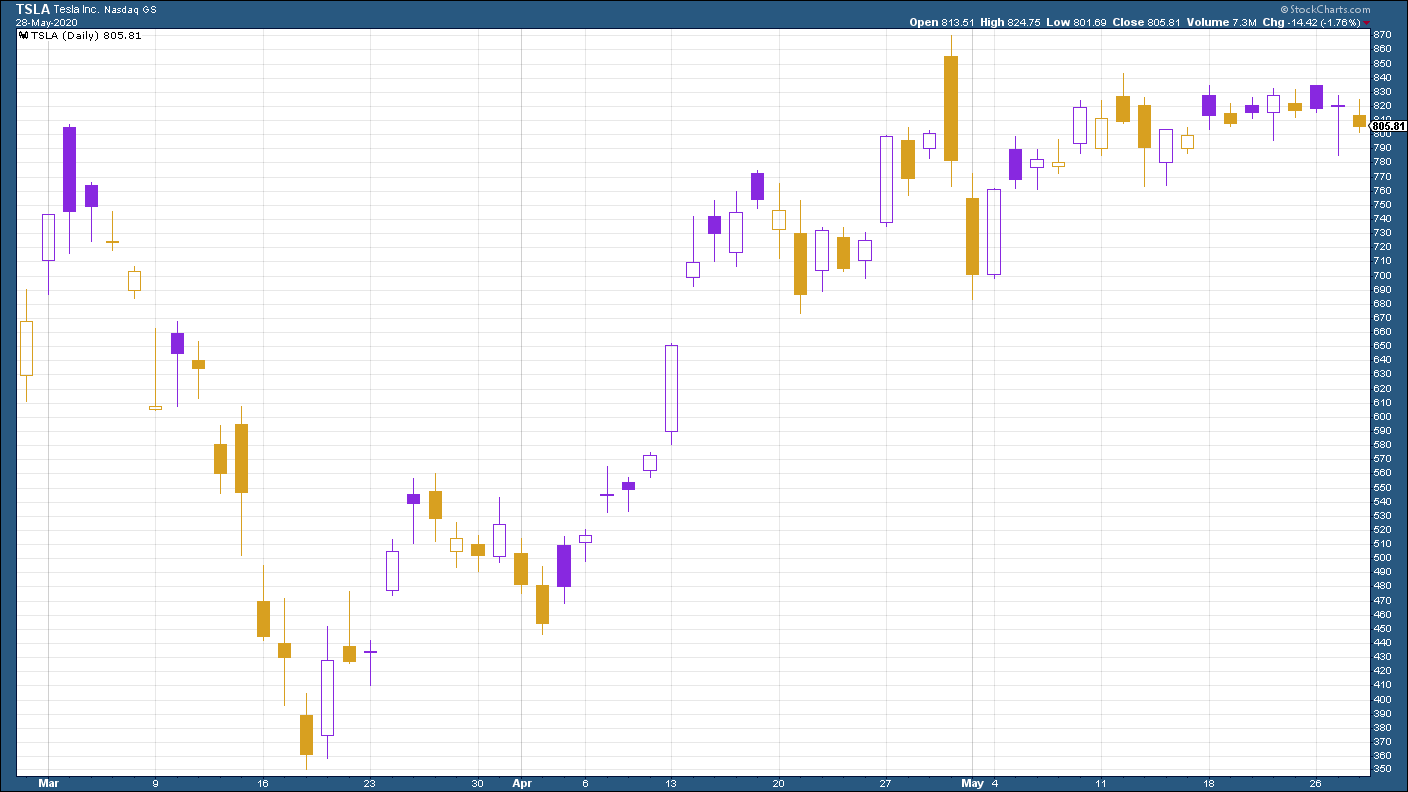
(Tesla: three months)
Get the latest financial news, insights and expert analysis from our award-winning MoneyWeek team, to help you understand what really matters when it comes to your finances.

-
 Should you buy an active ETF?
ETFs are often mischaracterised as passive products, but they can be a convenient way to add active management to your portfolio
-
 Power up your pension before 5 April – easy ways to save before the tax year end
With the end of the tax year looming, pension savers currently have a window to review and maximise what’s going into their retirement funds – we look at how
-
 UK wages grow at a record pace
The latest UK wages data will add pressure on the BoE to push interest rates even higher.
-
 Trapped in a time of zombie government
It’s not just companies that are eking out an existence, says Max King. The state is in the twilight zone too.
-
 America is in deep denial over debt
The downgrade in America’s credit rating was much criticised by the US government, says Alex Rankine. But was it a long time coming?
-
 UK economy avoids stagnation with surprise growth
Gross domestic product increased by 0.2% in the second quarter and by 0.5% in June
-
 Bank of England raises interest rates to 5.25%
The Bank has hiked rates from 5% to 5.25%, marking the 14th increase in a row. We explain what it means for savers and homeowners - and whether more rate rises are on the horizon
-
 UK inflation remains at 8.7% ‒ what it means for your money
Inflation was unmoved at 8.7% in the 12 months to May. What does this ‘sticky’ rate of inflation mean for your money?
-
 Would a food price cap actually work?
Analysis The government is discussing plans to cap the prices of essentials. But could this intervention do more harm than good?
-
 Is my pay keeping up with inflation?
Analysis High inflation means take home pay is being eroded in real terms. An online calculator reveals the pay rise you need to match the rising cost of living - and how much worse off you are without it.