The charts that matter: tell us what you’d do with £1,000 right now
With our 1,000th issue coming up, tell us what you'd do with £1,000 and you could feature in it. Plus, John Stepek looks at the charts that matter most to the global economy.

Get the latest financial news, insights and expert analysis from our award-winning MoneyWeek team, to help you understand what really matters when it comes to your finances.
You are now subscribed
Your newsletter sign-up was successful
Want to add more newsletters?

Twice daily
MoneyWeek
Get the latest financial news, insights and expert analysis from our award-winning MoneyWeek team, to help you understand what really matters when it comes to your finances.

Four times a week
Look After My Bills
Sign up to our free money-saving newsletter, filled with the latest news and expert advice to help you find the best tips and deals for managing your bills. Start saving today!
Welcome back.
The 999th issue of MoneyWeek came out yesterday (our front cover story is all about dividends, so you might want to subscribe right now if you haven’t already).
That means we’re prepping wildly for our 1,000th issue, which is out this Friday coming.
MoneyWeek
Subscribe to MoneyWeek today and get your first six magazine issues absolutely FREE

Sign up to Money Morning
Don't miss the latest investment and personal finances news, market analysis, plus money-saving tips with our free twice-daily newsletter
Don't miss the latest investment and personal finances news, market analysis, plus money-saving tips with our free twice-daily newsletter
Fancy the chance to be in it? Then answer me this: if you were handed £1,000 right now that you had to lock up in an investment for the next ten years, what would you buy? You can choose whatever you want: a share, bonds, a fund, a bar of gold, cash (but tell us which currency) – just remember that once you’ve invested, you can’t get it back until 2030.
Email your ideas to editor@moneyweek.com. We’ll be printing the best in the 1,000th issue – but get them in quick, I really need them by the end of play on Monday if they’re to stand a chance of getting into print.
Brendan Connolly returns on the podcast – don’t miss this one
Merryn interviewed one of our favourite analysts for the podcast this week – the extremely smart Bernard Connolly. This time round, Bernard wasn’t discussing the European Union – instead he and Merryn discuss Britain’s current spending levels and he explains why the government approach is the right one – for now at least.
Conor also kindly gave me the chance to plug my book on contrarian investing, The Sceptical Investor. I highly recommend it, obviously – in paperback, ebook or on Audible.
Have you tried our new Quiz of the Week yet? See what you can remember and what you missed of the economic and political events of the past seven days.
And here are the links for this week’s editions of Money Morning plus other stories you might have missed on the website this week.
- Monday:For how long can stockmarkets ignore rising unemployment?
- Merryn’s blog: Caught with the wrong portfolio? You're in good company
- Tuesday:Alternative assets are now mainstream – but should you buy in?
- Wednesday: Bitcoin has just “halved” again – what does that mean, and should you buy in?
- Thursday: The English housing market is open for business again – what happens now?
- Friday: The oil market is showing signs of life again
The housing market – your views
This week, the English housing market re-opened for business. A few weeks ago, I asked you for your experiences and views on what’s going on and I got some very interesting responses. Here’s a small sample of the range of opinions.
One reader, who had the good fortune to sell his property two days before lockdown kicked in and was left sitting on a healthy cash budget with no need for a mortgage – the ideal position you’d think – was nevertheless not optimistic about his chances of finding a bargain.
“It seems to me that the housing market is currently being propped up by two things. Firstly, the remarkable ease with which prospective purchases can access credit (together with the historically low interest rates) and secondly, the marked dearth of (suitable) properties that are available to buy.”
Our reader doesn’t see either of those things changing significantly. If the government is willing to pay the salaries of those on furlough, “I have no difficulty in imagining that they will prop up the property market by novel, if uncosted amounts.” And nor does he expect a large jump in long-term unemployment.
In short, we have “a government that is willing to throw money at anything that moves. So I don’t actually believe much will change at all.”
This notion that the government is likely to prop the market up kept returning over and over again. What’s interesting though is that this was usually expressed with something of a sigh (which I’m glad about) – I get the impression that readers regard this as an unfortunate reality rather than something to be grateful for (although perhaps that’s because it was mostly potential buyers expressing this view).
Others did expect more significant house price declines. One reader who had recently sold and moved into rented accommodation, noted that while furloughing would save many jobs, “business are about to truly feel the pinch… risks remain high off a second spike, and once furloughing is over, they will cut jobs ‘in case’”.
Meanwhile, families who have realised under lockdown that they “have no rainy day funds, or those who have lost income, will halt all but essential spending.” In turn, lenders will be less generous in their terms and more wary of who they give loans to.
None of these are bad points. I stand by my view that we’re looking at stagnation rather than a crash (or rampant reflation for that matter), but I am open minded and I don’t have high conviction in any one outcome. I realise that’s unhelpful so for a more detailed version of my views, check out Thursday’s Money Morning.
Beyond talking about pricing, another reader made an interesting point on the cost of building houses outside London. While house prices in the capital have shot up, the rate of growth has been less rapid elsewhere in the UK, and “as materials, labour and regulation costs have increased, the margin in many areas is already on the edge of viability.”
This suggests that house building in many regions will just “dry up, leading to increased housing supply shortages.” Land prices in these areas have already fallen, reflecting the lack of profitability on some of these homes. It’s an interesting point and one I’d be keen to hear more on from those of you in the building trade.
And one of our readers made a good point about home working, pointing out that two local companies had already decided to share offices post-pandemic, in order to save a huge amount on rent.
With a growing number of people working more regularly from home, “families will want larger homes with maybe not just one but two offices, which in turn could see an uptick for large five or six bedroomed older homes at the seaside and in the countryside. And a return of the importance of large gardens both as a relaxation space and to grow veg and keep chickens.”
That sounds nice. Something to look forward to maybe. Anyway, thanks again for all your comments – do keep them coming.
And now onto today’s charts of the week.
The charts that matter
Gold (measured in dollar terms) took off towards the end of the week, partly because investors are starting to believe that the next step for the US might be the negative interest rates that president Donald Trump is clamouring for. For more on how to invest in gold, and gold miners, don’t miss Dominic’s recent cover story on the topic in MoneyWeek – if you’re not a subscriber, sign up here now.
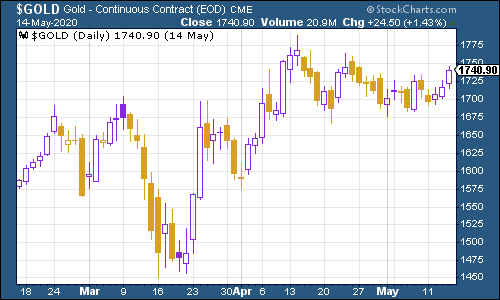
(Gold: three months)
The US dollar index – a measure of the strength of the dollar against a basket of the currencies of its major trading partners – headed towards the top of its range again. If it breaks higher, that’s a scary sign for markets (if you need to know why, just look at what it did during the lockdown as everyone rushed for “safe” havens).
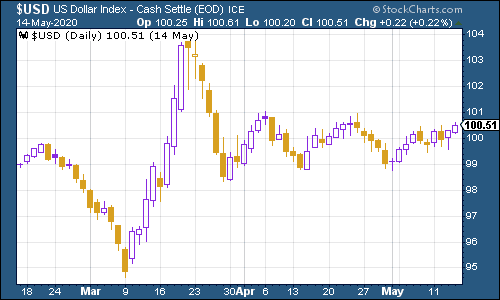
(DXY: three months)
The Chinese yuan (or renminbi) remains above the $1/¥7 mark and it appears to be ticking higher. That’s a deflationary warning sign and more specifically it suggests that the US dollar is getting a bit on the strong side. Of all the charts this particular week, this is the one I think that bears the most monitoring.
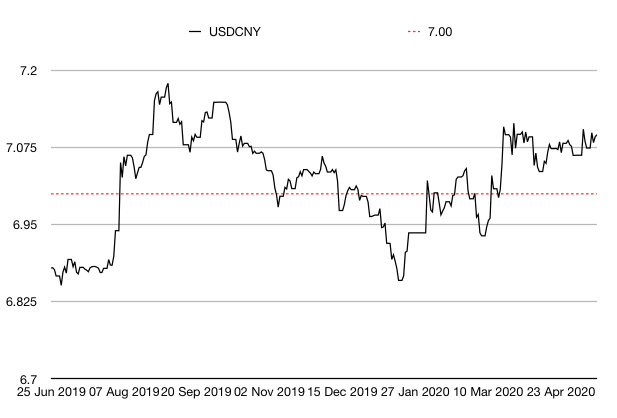
(Chinese yuan to the US dollar: since 25 Jun 2019)
The yield on the ten-year US government bond was barely changed this week, still crawling along the bottom.
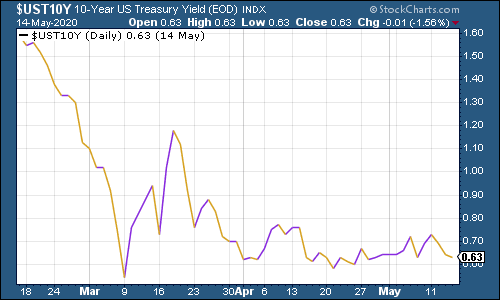
(Ten-year US Treasury yield: three months)
It was a similar story for the yield on the Japanese ten-year...
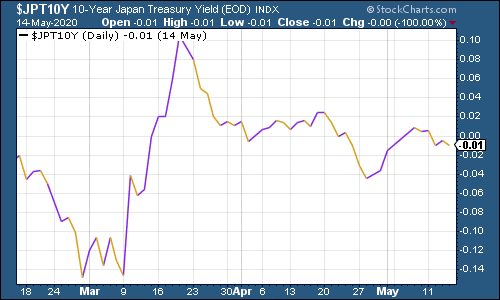
(Ten-year Japanese government bond yield: three months)
… and again for the yield on the ten-year German bund despite the recent spat between Germany’s constitutional court and that of the EU.
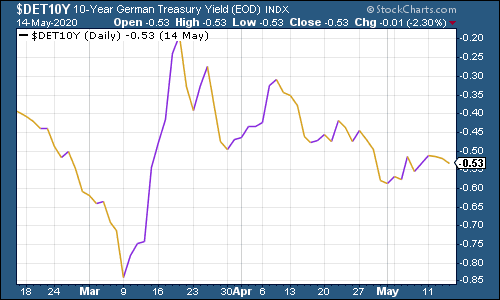
(Ten-year Bund yield: three months)
Copper continues to hold up reasonably well.
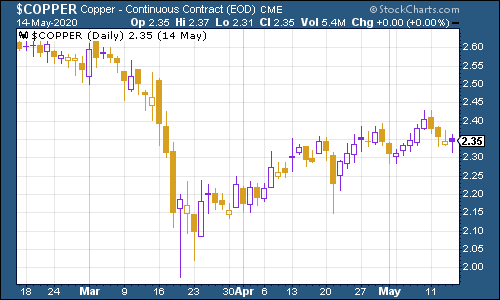
(Copper: three months)
The Aussie dollar was little changed on the week despite some concerns over a deterioration of the country’s relations with China.
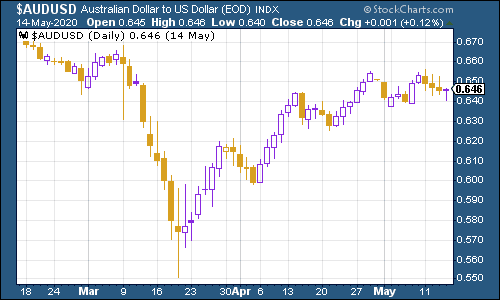
(Aussie dollar vs US dollar exchange rate: three months)
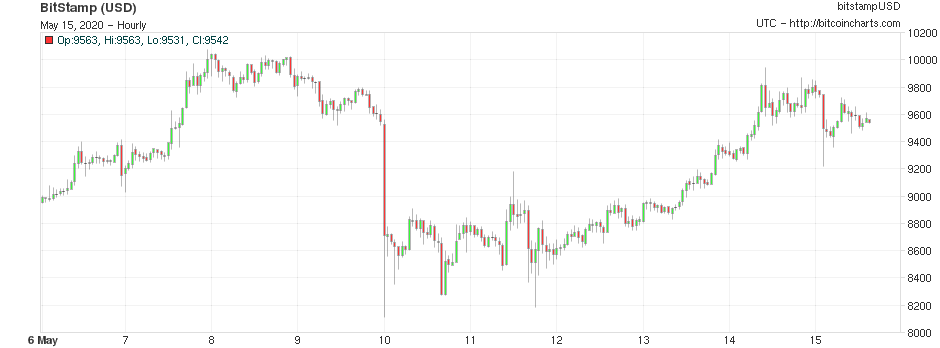
Cryptocurrency bitcoin had a more volatile week which is probably something to do with excitement over it “halving” – Dominic explained more here.
(Bitcoin: ten days)
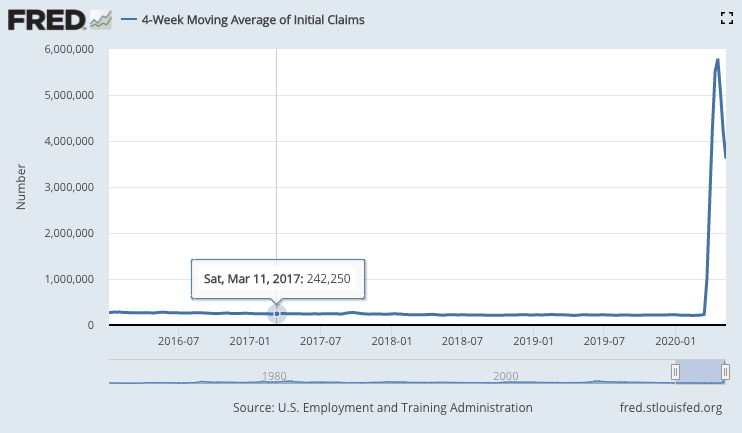
This week’s US weekly jobless claims figure of 2.98 million was grim and somewhat worse than expected (economists had gone for 2.5 million on average), although at least it is heading in the right direction (last week’s was 3.17 million). The four-week moving average now sits at 3.62 million, compared to last week’s 4.17 million.
(US jobless claims, four-week moving average: since January 2016)
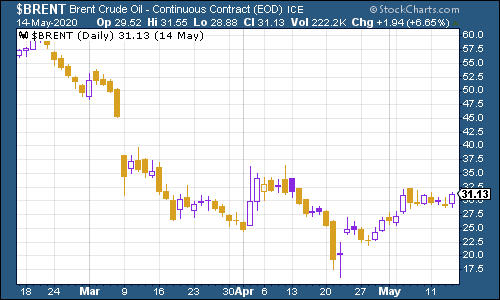
The oil price just keeps ticking higher as investors feel a bit more optimistic now that Saudi Arabia is cutting production dramatically.
(Brent crude oil: three months)
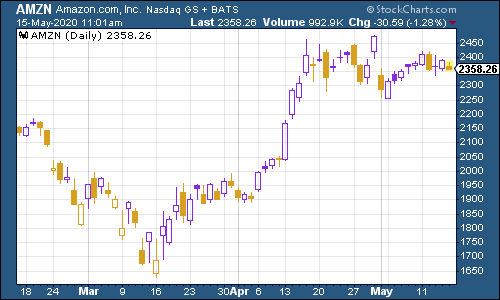
Amazon shares remain near their record high, ranging along in line with the wider market.
(Amazon: three months)
And it was a similar story for electric car group Tesla this week.
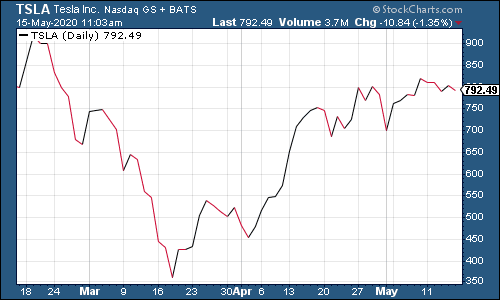
(Tesla: three months)
Have a good weekend.
John
Get the latest financial news, insights and expert analysis from our award-winning MoneyWeek team, to help you understand what really matters when it comes to your finances.

-
 Average UK house price reaches £300,000 for first time, Halifax says
While the average house price has topped £300k, regional disparities still remain, Halifax finds.
-
 Barings Emerging Europe trust bounces back from Russia woes
Barings Emerging Europe trust has added the Middle East and Africa to its mandate, delivering a strong recovery, says Max King
-
 UK wages grow at a record pace
The latest UK wages data will add pressure on the BoE to push interest rates even higher.
-
 Trapped in a time of zombie government
It’s not just companies that are eking out an existence, says Max King. The state is in the twilight zone too.
-
 America is in deep denial over debt
The downgrade in America’s credit rating was much criticised by the US government, says Alex Rankine. But was it a long time coming?
-
 UK economy avoids stagnation with surprise growth
Gross domestic product increased by 0.2% in the second quarter and by 0.5% in June
-
 Bank of England raises interest rates to 5.25%
The Bank has hiked rates from 5% to 5.25%, marking the 14th increase in a row. We explain what it means for savers and homeowners - and whether more rate rises are on the horizon
-
 UK inflation remains at 8.7% ‒ what it means for your money
Inflation was unmoved at 8.7% in the 12 months to May. What does this ‘sticky’ rate of inflation mean for your money?
-
 Would a food price cap actually work?
Analysis The government is discussing plans to cap the prices of essentials. But could this intervention do more harm than good?
-
 Is my pay keeping up with inflation?
Analysis High inflation means take home pay is being eroded in real terms. An online calculator reveals the pay rise you need to match the rising cost of living - and how much worse off you are without it.