The charts that matter: corona panic breaks out
As the markets finally succumbed to coronavirus fears, John Stepek looks at how it's affected the charts that matter most to the global economy.

Get the latest financial news, insights and expert analysis from our award-winning MoneyWeek team, to help you understand what really matters when it comes to your finances.
You are now subscribed
Your newsletter sign-up was successful
Want to add more newsletters?

Twice daily
MoneyWeek
Get the latest financial news, insights and expert analysis from our award-winning MoneyWeek team, to help you understand what really matters when it comes to your finances.

Four times a week
Look After My Bills
Sign up to our free money-saving newsletter, filled with the latest news and expert advice to help you find the best tips and deals for managing your bills. Start saving today!
Welcome back.
On the podcast front – Merryn and I will be recording a new one, and no doubt discussing a certain virus, early next week. Meanwhile, if you missed me interviewing Dominic Frisby about his new book Daylight Robbery last week, you can listen to it here.
Here are the links for this week’s editions of Money Morning in case you missed any.
MoneyWeek
Subscribe to MoneyWeek today and get your first six magazine issues absolutely FREE

Sign up to Money Morning
Don't miss the latest investment and personal finances news, market analysis, plus money-saving tips with our free twice-daily newsletter
Don't miss the latest investment and personal finances news, market analysis, plus money-saving tips with our free twice-daily newsletter
- Monday: A global coronavirus pandemic seems inevitable – are markets still too complacent?
- Tuesday: How to build a properly diversified investment trust portfolio
- Wednesday: Gold, coronavirus, and the high cost of face masks in northern Italy
- Thursday: Will coronavirus kill off the bull market?
- Friday: What to look out for as panic over coronavirus spreads
- Subscribe: Get your first 12 issues of MoneyWeek for £12
And keep 22 May free! We’ll be telling you more about our next event very very soon – what with the havoc that’s been wrought on markets in the last week or so, you’ll want to make sure you’re free to come along!
The charts that matter
It was all about coronavirus this week as markets finally succumbed to fear. The US yield curve – as measured by the gap between the yield on the ten-year US Treasury (government bond) and the two-year – remains close to being flat.
The yield curve inverted (the two year was yielding more than the ten year) in the middle of last year. That’s been a reliable recession signal since at least World War II.
Of course, the inverted yield curve could never have predicted coronavirus. So it’s a little ironic that if the disease does trigger a US recession, it would validate the red flag. It’s the kind of thing that makes your brain hurt if you think about it for too long. Like the plot of The Terminator.
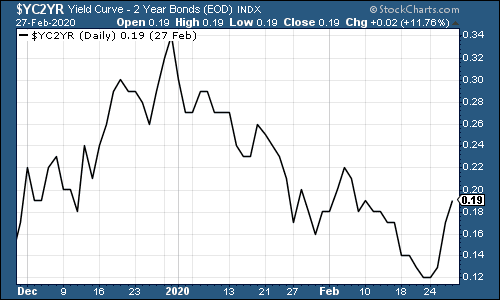
(The gap between the yield on the ten-year US Treasury and that on the two-year: three months)
Gold (measured in dollar terms) had a solid week right up until Friday, which is when it slid hard as investors apparently got margin called (in other words, they had to sell the liquid stuff and the good stuff that they owned in order to fund the losses they’d made on other assets). The chart below only goes up to the close on Thursday, so you can’t see the Friday drop.
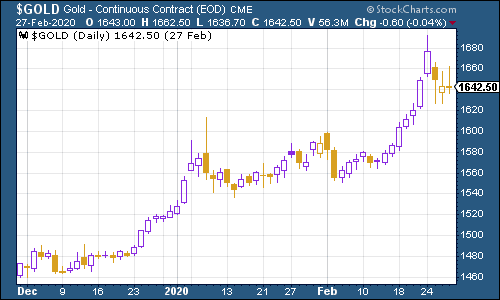
(Gold: three months)
The US dollar index – a measure of the strength of the dollar against a basket of the currencies of its major trading partners – actually weakened this week. That’s interesting – as a “safe haven” you’d have expected the dollar to strengthen.
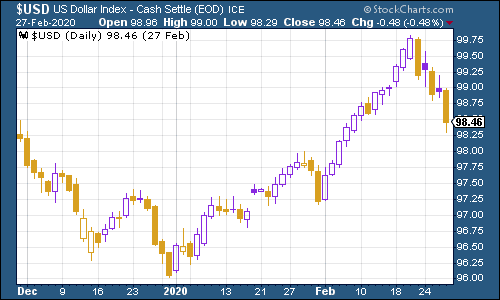
(DXY: three months)
That meant the Chinese yuan (or renminbi) remained relatively strong this week, sitting only just above the $1/¥7 mark that gets markets worried.
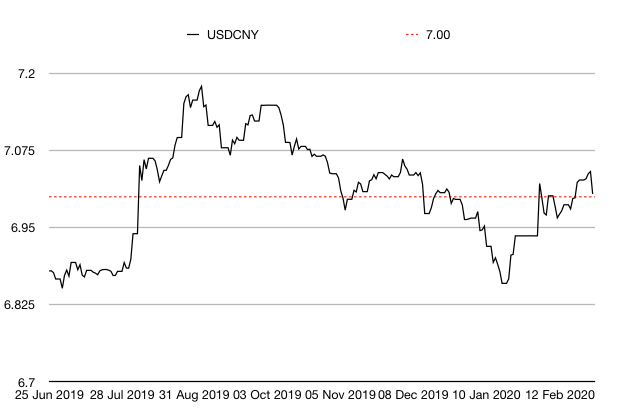
(Chinese yuan to the US dollar: since 25 June 2019)
The yield on the ten-year US government bond slid hard as investors got gloomy.
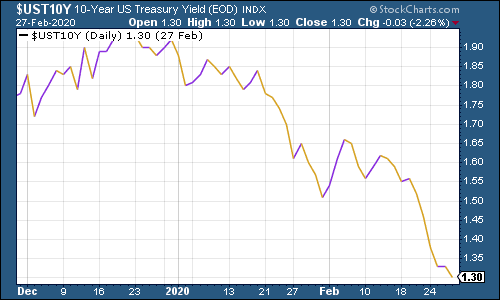
(Ten-year US Treasury yield: three months)
The yield on the Japanese ten-year fell too.
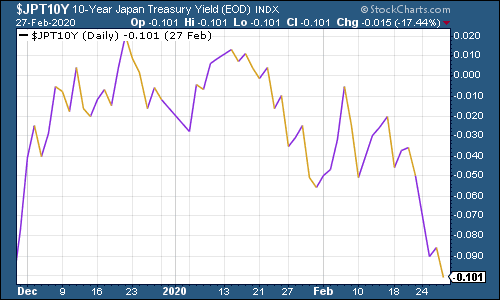
(Ten-year Japanese government bond yield: three months)
And the yield on the ten-year German Bund followed suit.
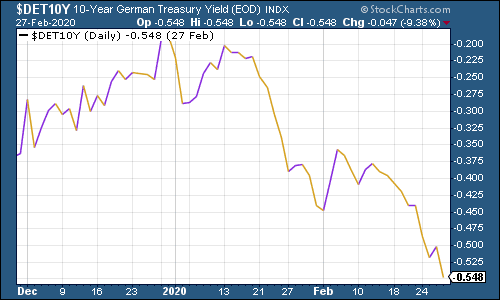
(Ten-year Bund yield: three months)
Copper held out for most of the week and then gave up the ghost on Friday, sliding towards the $2.50 mark.
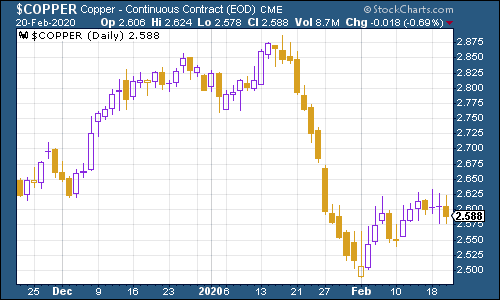
(Copper: six months)
Despite the weakness of the US dollar, the Aussie dollar was weaker, as you’d expect, given its reliance on China.
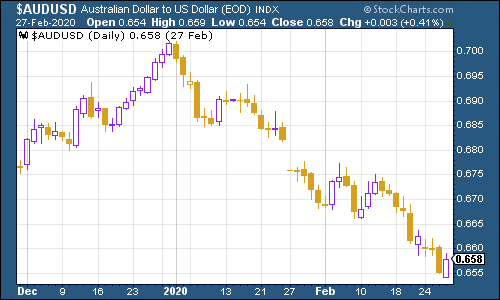
(Aussie dollar vs US dollar exchange rate: three months)
Cryptocurrency bitcoin has fallen back sharply this week. It’s not really working as a safe haven, it seems.
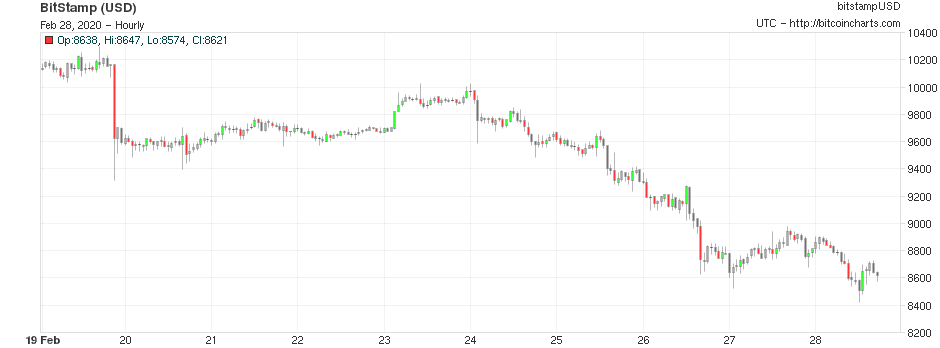
(Bitcoin: ten days)
US weekly jobless claims rose to 219,000 (from 211,000 – the previous week’s figures were revised higher by 1,000 claims). The four-week moving average now sits at 209,750. When the four-week moving average troughs, the market often hits a top soon after.
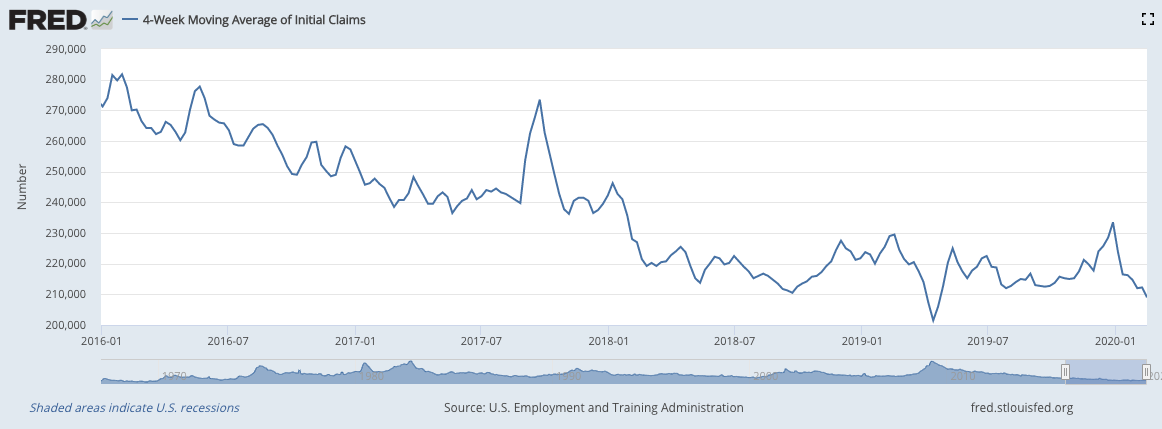
(US jobless claims, four-week moving average: since January 2016)
The oil price (as measured by Brent crude, the international/European benchmark) slid hard as markets decided that economic growth is going to take a real knock.
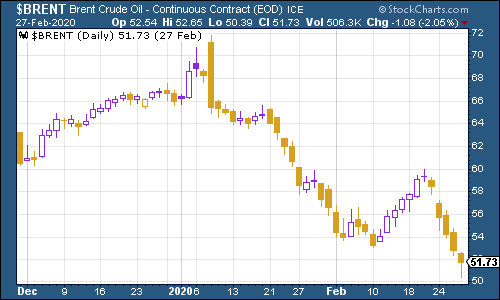
(Brent crude oil: three months)
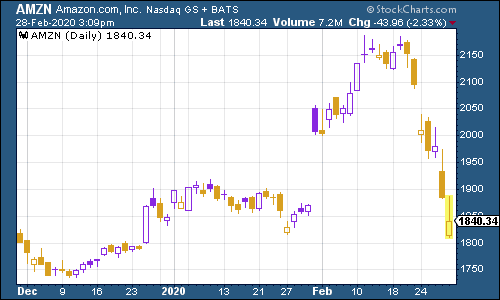
Retail behemoth Amazon crashed along with the wider market.
(Amazon: three months)
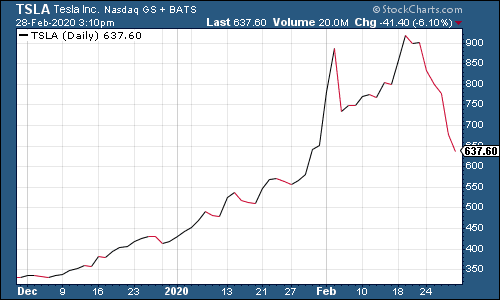
And even electric car group Tesla – which often goes in the opposite direction to the rest of the market – couldn’t sustain its recent momentum, collapsing from above $900 a share to around $640 by the end of the week.
That’s a bear market right there…
(Tesla: three months)
Is this capitulation? I’m wondering what next week will have in store for us.
Meanwhile, have a great weekend, and don’t overly stress about your portfolio. If you have a plan in place, this is noise. If you don’t have a plan in place, use this as a learning experience – and get one.
Get the latest financial news, insights and expert analysis from our award-winning MoneyWeek team, to help you understand what really matters when it comes to your finances.

-
 Can mining stocks deliver golden gains?
With gold and silver prices having outperformed the stock markets last year, mining stocks can be an effective, if volatile, means of gaining exposure
-
 8 ways the ‘sandwich generation’ can protect wealth
People squeezed between caring for ageing parents and adult children or younger grandchildren – known as the ‘sandwich generation’ – are at risk of neglecting their own financial planning. Here’s how to protect yourself and your loved ones’ wealth.
-
 UK wages grow at a record pace
The latest UK wages data will add pressure on the BoE to push interest rates even higher.
-
 Trapped in a time of zombie government
It’s not just companies that are eking out an existence, says Max King. The state is in the twilight zone too.
-
 America is in deep denial over debt
The downgrade in America’s credit rating was much criticised by the US government, says Alex Rankine. But was it a long time coming?
-
 UK economy avoids stagnation with surprise growth
Gross domestic product increased by 0.2% in the second quarter and by 0.5% in June
-
 Bank of England raises interest rates to 5.25%
The Bank has hiked rates from 5% to 5.25%, marking the 14th increase in a row. We explain what it means for savers and homeowners - and whether more rate rises are on the horizon
-
 UK inflation remains at 8.7% ‒ what it means for your money
Inflation was unmoved at 8.7% in the 12 months to May. What does this ‘sticky’ rate of inflation mean for your money?
-
 Would a food price cap actually work?
Analysis The government is discussing plans to cap the prices of essentials. But could this intervention do more harm than good?
-
 Is my pay keeping up with inflation?
Analysis High inflation means take home pay is being eroded in real terms. An online calculator reveals the pay rise you need to match the rising cost of living - and how much worse off you are without it.