Get the latest financial news, insights and expert analysis from our award-winning MoneyWeek team, to help you understand what really matters when it comes to your finances.
You are now subscribed
Your newsletter sign-up was successful
Want to add more newsletters?

Twice daily
MoneyWeek
Get the latest financial news, insights and expert analysis from our award-winning MoneyWeek team, to help you understand what really matters when it comes to your finances.

Four times a week
Look After My Bills
Sign up to our free money-saving newsletter, filled with the latest news and expert advice to help you find the best tips and deals for managing your bills. Start saving today!
Welcome back.
This week, we’re looking at a very exciting new sector. As you’re probably aware, there has been a lot of focus on the meat industry recently, especially over its carbon emissions. So, what can you do if you’ve got a taste for prime steak but would rather leave the animals out of the equation altogether? Enter lab-grown meat – ”cuts of meat that have involved no cruelty to the animal or harm to the environment, having been cultured from harvested animal cells in a laboratory”. Stuart Watkins looks at the state of the industry now and how investors can get a taste.
Elsewhere, Stephen Connolly casts his eye over another relatively new industry - the burgeoning “buy now pay later” sector that includes start-up companies including Klarna and Clearpay. But it’s not just startups, the big names are also showing an interest. Stephen picks some of the best stocks in the sector for you to consider.
MoneyWeek
Subscribe to MoneyWeek today and get your first six magazine issues absolutely FREE

Sign up to Money Morning
Don't miss the latest investment and personal finances news, market analysis, plus money-saving tips with our free twice-daily newsletter
Don't miss the latest investment and personal finances news, market analysis, plus money-saving tips with our free twice-daily newsletter
If you’re not already a subscriber, sign up here and get your first six issues free.
Merryn is joined by Dale Robertson in this week’s podcast. Dale is co-manager of the Chelverton European Select Fund, and he tells Merryn why it’s such an exciting time to be investing in Europe, especially in small and micro-cap stocks. Listen to what he has to say here.
Here are the links for this week’s editions of Money Morning and other web articles you may have missed:
- Monday Money Morning: The one thing that can pop the house price bubble
- Tuesday Money Morning: Meme coins can be a laugh or even make you money – but they’re also scam central
- Wednesday Money Morning: Are investors doomed?
- Thursday Money Morning: The Federal Reserve is printing less money – so why have markets hit record levels?
- Friday Money Morning: The Bank of England gives markets a shock
- Cryptocurrency roundup: Ether hits a new high and a dramatic week for dogecoin-inspired SHIB
Now for the charts of the week.
Gold is hovering at around $1,800 an ounce. Having slid earlier on the back of positive US economic data, the yellow metal recovered after the Federal Reserve was a little more dovish than expected, and the Bank of England was a lot more dovish than expected – implying that developed world central bankers aren’t quite as ready to hike rates as everyone had perhaps started to believe.
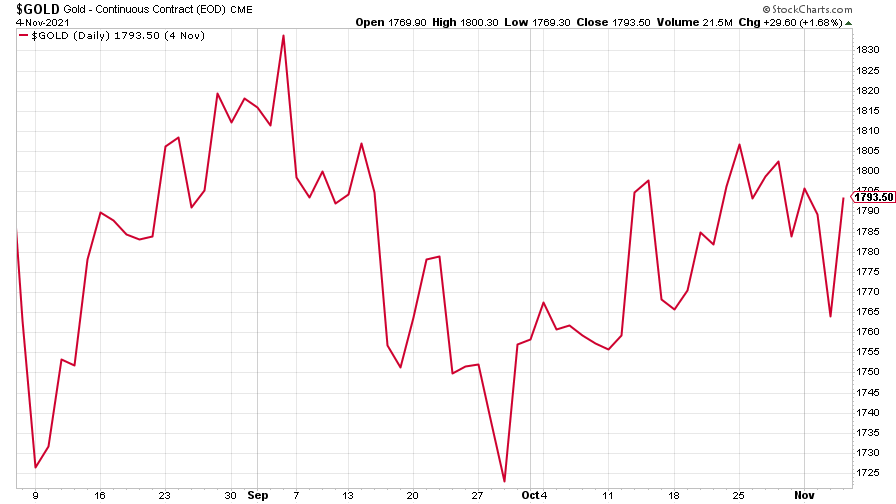
(Gold: three months)
The US dollar index (DXY – a measure of the strength of the dollar against a basket of the currencies of its major trading partners) had a mixed week after the Fed started “tapering” its quantitative easing programme.
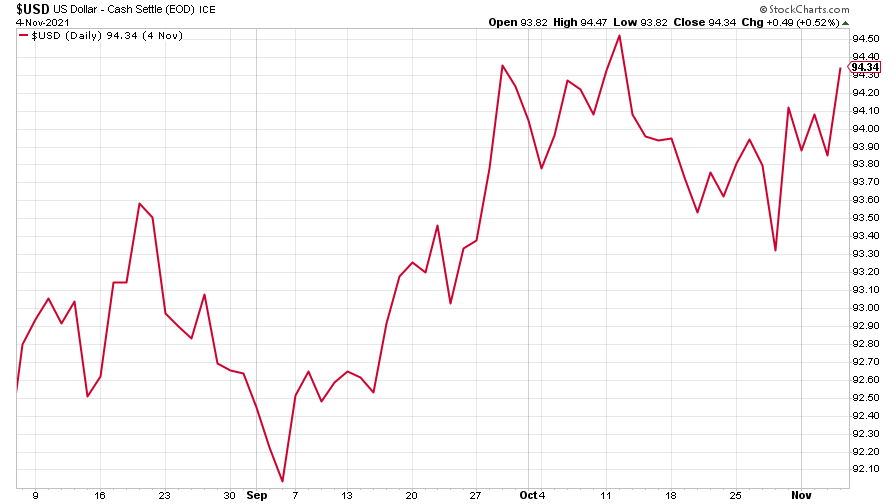
(DXY: three months)
The Chinese yuan (or renminbi) strengthened against the US dollar (when the red line is rising, the dollar is strengthening while the yuan is weakening).
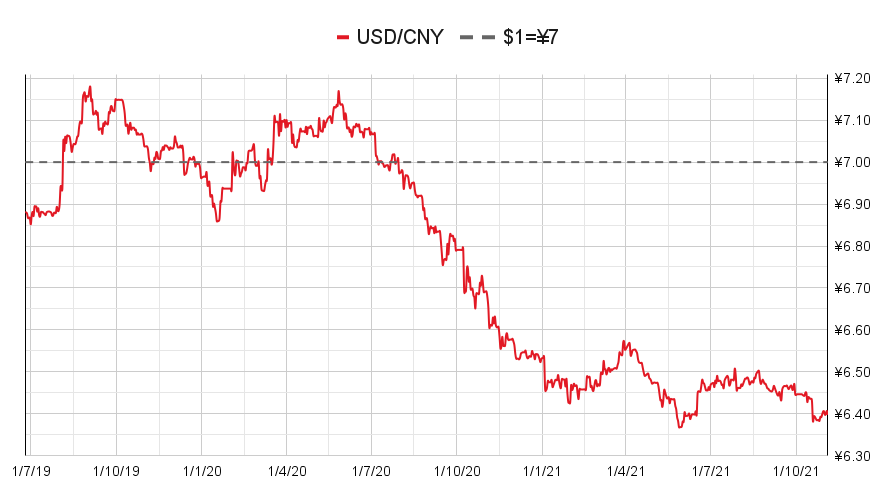
(Chinese yuan to the US dollar: since 25 Jun 2019)
The yield on the ten-year US government bond slipped.
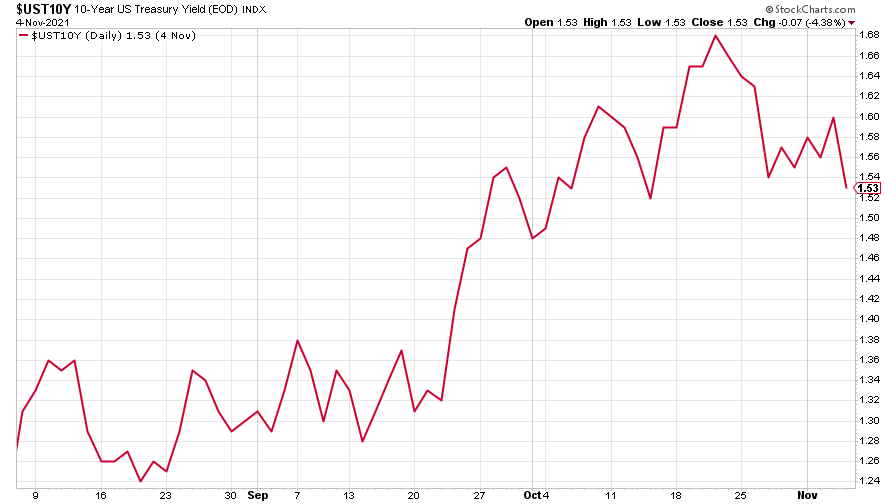
(Ten-year US Treasury yield: three months)
The yield on the Japanese ten-year bond fell hard (bearing in mind that we’re still talking just a few basis points – one basis point being 0.01 of a percent – here).
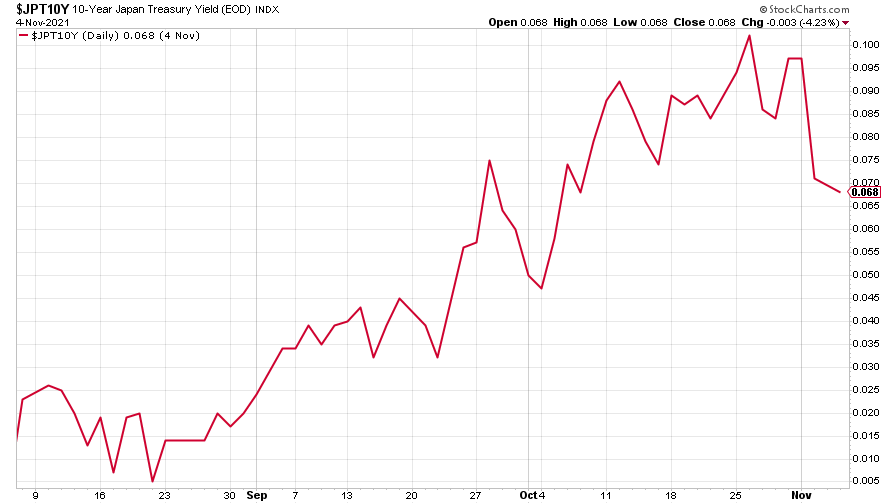
(Ten-year Japanese government bond yield: three months)
And the yield on the ten-year German Bund retreated, too.
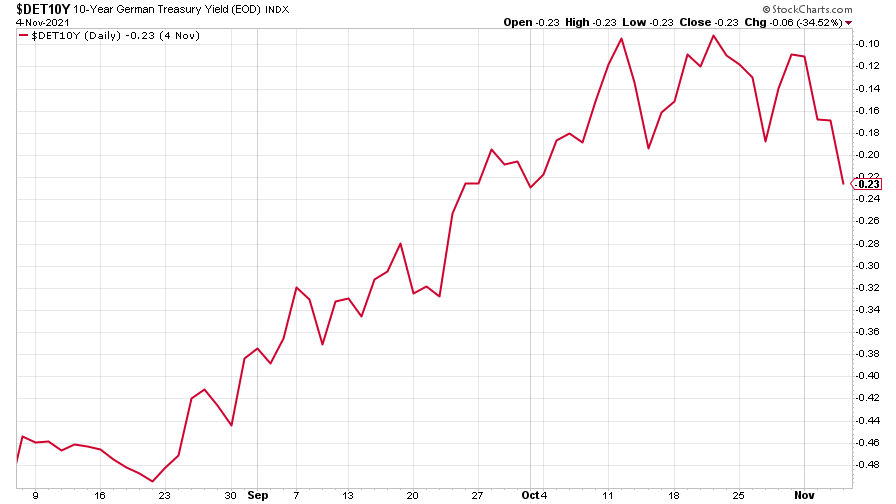
(Ten-year Bund yield: three months)
Copper prices continued to fall.
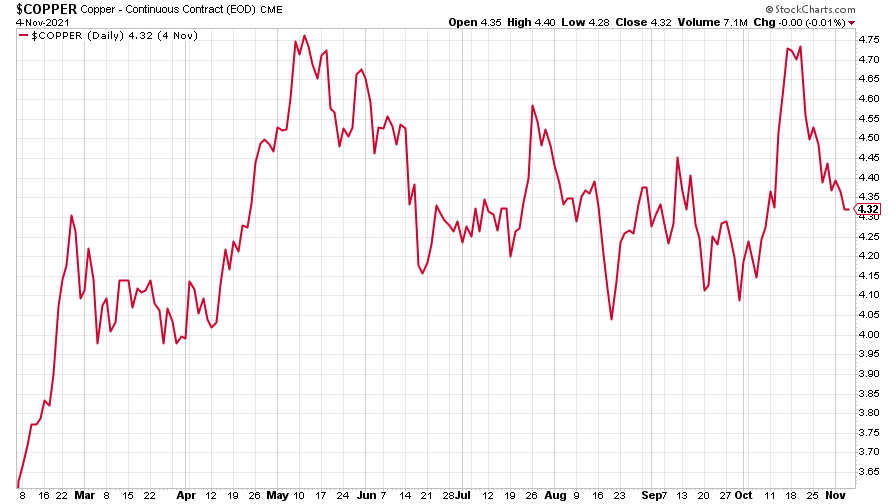
(Copper: nine months)
The closely related Aussie dollar fell in sympathy.
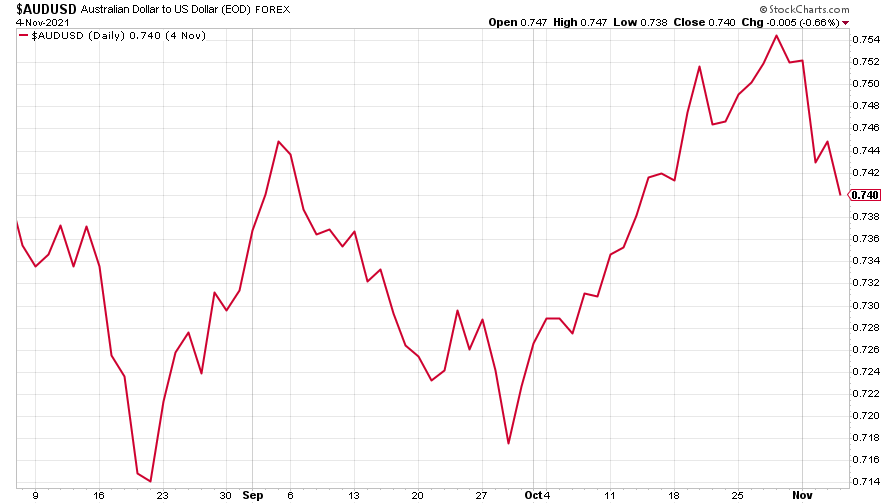
(Aussie dollar vs US dollar exchange rate: three months)
Bitcoin is off its all-time high but is still holding out at over $60,000.
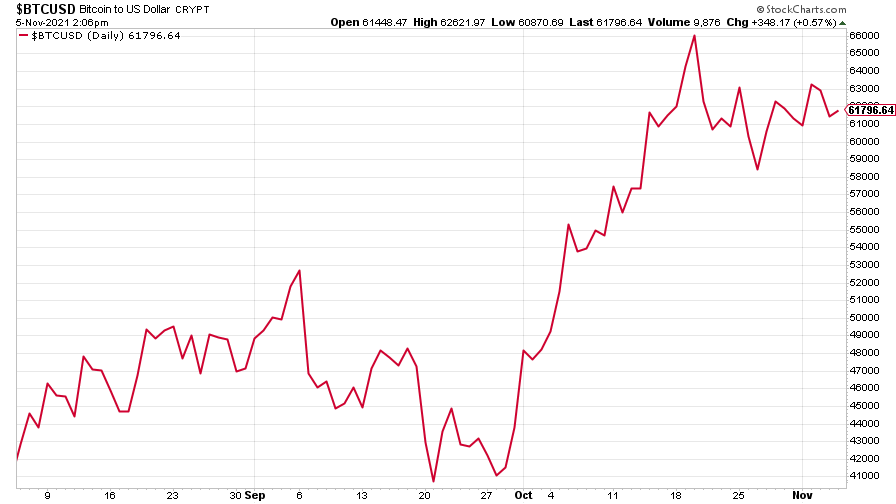
(Bitcoin: three months)
US weekly initial jobless claims fell by 14,000 to 269,000. The four-week moving average fell by 15,000 to 284,750. Meanwhile US non-farm payrolls were a good bit stronger than expected.
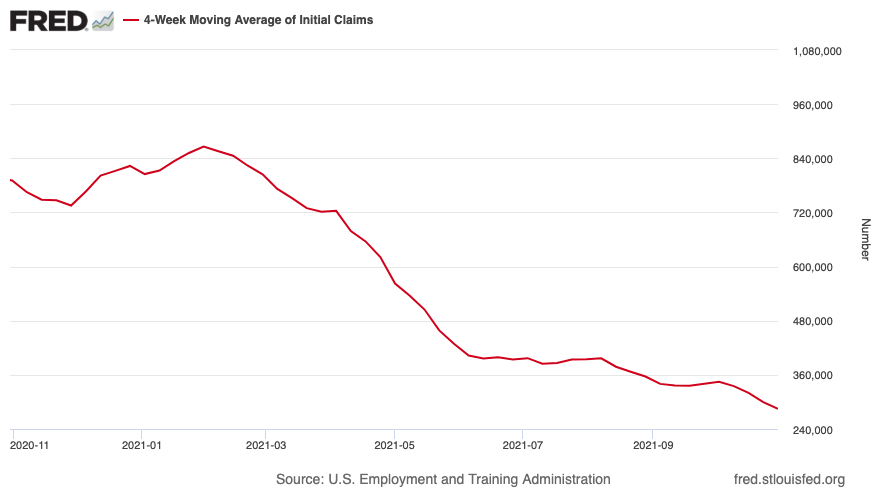
(US initial jobless claims, four-week moving average: since Jan 2020)
The oil price fell, sliding back from its recent highs despite oil cartel Opec promising to keep production at current levels.
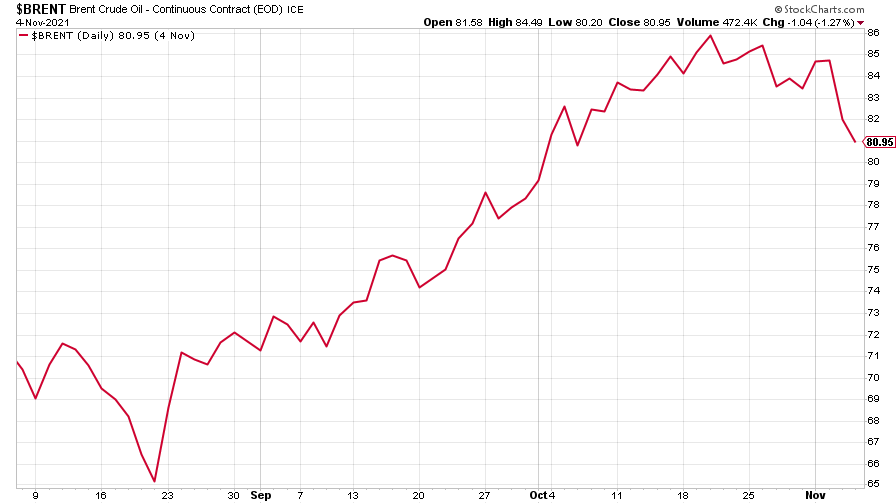
(Brent crude oil: three months)
Amazon's stock saw another big rise as both the Nasdaq and the S&P 500 hit new records.
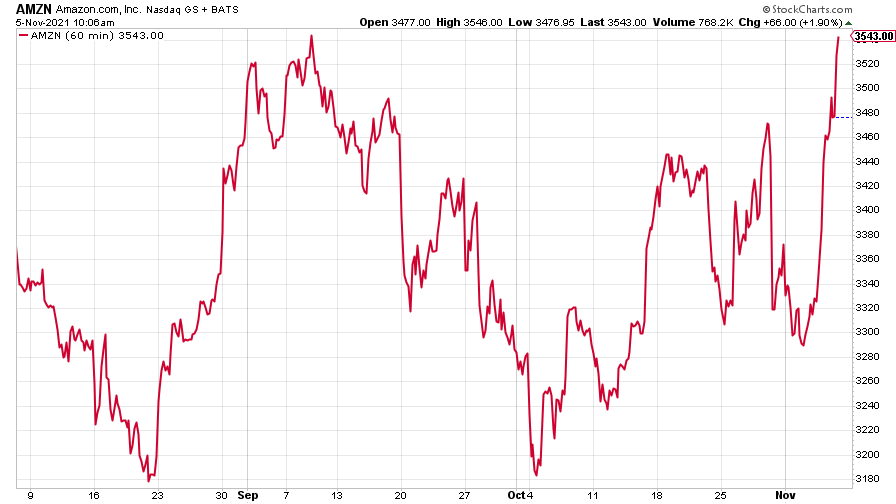
(Amazon: three months)
Tesla continued its apparently unstoppable climb.
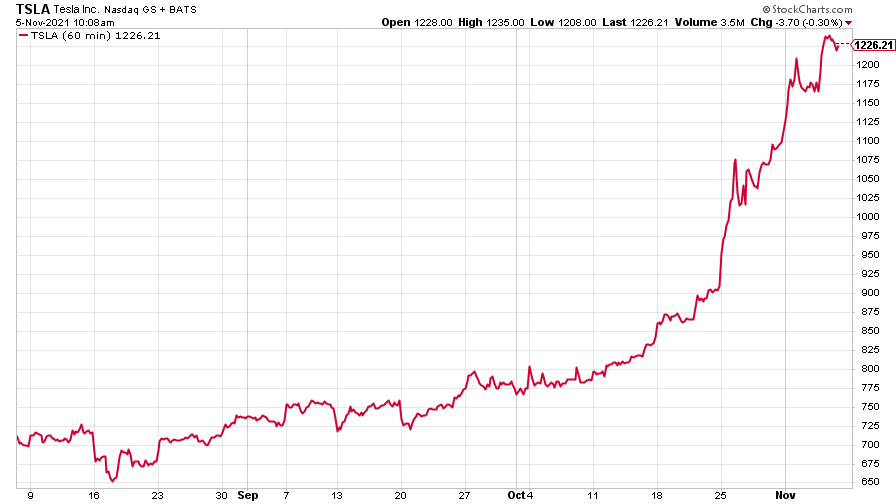
(Tesla: three months)
Have a great weekend.
Get the latest financial news, insights and expert analysis from our award-winning MoneyWeek team, to help you understand what really matters when it comes to your finances.

-
 Can mining stocks deliver golden gains?
With gold and silver prices having outperformed the stock markets last year, mining stocks can be an effective, if volatile, means of gaining exposure
-
 8 ways the ‘sandwich generation’ can protect wealth
People squeezed between caring for ageing parents and adult children or younger grandchildren – known as the ‘sandwich generation’ – are at risk of neglecting their own financial planning. Here’s how to protect yourself and your loved ones’ wealth.
-
 How a dovish Federal Reserve could affect you
Trump’s pick for the US Federal Reserve is not so much of a yes-man as his rival, but interest rates will still come down quickly, says Cris Sholto Heaton
-
 New Federal Reserve chair Kevin Warsh has his work cut out
Opinion Kevin Warsh must make it clear that he, not Trump, is in charge at the Fed. If he doesn't, the US dollar and Treasury bills sell-off will start all over again
-
 'Investors should brace for Trump’s great inflation'
Opinion Donald Trump's actions against Federal Reserve chair Jerome Powell will likely stoke rising prices. Investors should prepare for the worst, says Matthew Lynn
-
 'Governments are launching an assault on the independence of central banks'
Opinion Say goodbye to the era of central bank orthodoxy and hello to the new era of central bank dependency, says Jeremy McKeown
-
 Do we need central banks, or is it time to privatise money?
Analysis Free banking is one alternative to central banks, but would switching to a radical new system be worth the risk?
-
 Will turmoil in the Middle East trigger inflation?
The risk of an escalating Middle East crisis continues to rise. Markets appear to be dismissing the prospect. Here's how investors can protect themselves.
-
 Federal Reserve cuts US interest rates for the first time in more than four years
Policymakers at the US central bank also suggested rates would be cut further before the year is out
-
 The Bank of England can’t afford to hike interest rates again
With inflation falling, the cost of borrowing rising and the economy heading into an election year, the Bank of England can’t afford to increase interest rates again.
