The US dollar is in a bull market. That’s bad news for most assets
Even with the Federal Reserve printing money hand over fist, the US dollar has made a bottom and is now in a bull market. That has serious implications for investors, says Dominic Frisby.

Get the latest financial news, insights and expert analysis from our award-winning MoneyWeek team, to help you understand what really matters when it comes to your finances.
You are now subscribed
Your newsletter sign-up was successful
Want to add more newsletters?

Twice daily
MoneyWeek
Get the latest financial news, insights and expert analysis from our award-winning MoneyWeek team, to help you understand what really matters when it comes to your finances.

Four times a week
Look After My Bills
Sign up to our free money-saving newsletter, filled with the latest news and expert advice to help you find the best tips and deals for managing your bills. Start saving today!
The big story now, as far as I’m concerned, is that the US dollar is in a bull market.
As a “sound money” advocate, I would prefer it were not so. Gold, miners, bitcoin – they all do better when the dollar is falling. Our anti-fiat-money biases are confirmed when the dollar is falling.
“Look, the Fed is printing money”, we can say, “and look at the resulting loss in purchasing power.”
MoneyWeek
Subscribe to MoneyWeek today and get your first six magazine issues absolutely FREE

Sign up to Money Morning
Don't miss the latest investment and personal finances news, market analysis, plus money-saving tips with our free twice-daily newsletter
Don't miss the latest investment and personal finances news, market analysis, plus money-saving tips with our free twice-daily newsletter
The Fed is printing money. And fiat money is losing its purchasing power, especially against debt-based financial instruments. Such as houses.
But let us not gloss over the fact that the US dollar has made a clear bottom. To do so would be to delude ourselves. The US dollar is now rising. It is in something of a bull market. And there are investment implications to that.
The US dollar’s double bottom
Starting with the US dollar index, which is the dollar versus a basket of the currencies of its major trading partners (the euro, the pound, the yen, Canadian dollar and so on), here is the offending chart – as textbook a “W bottom” as you will ever see.
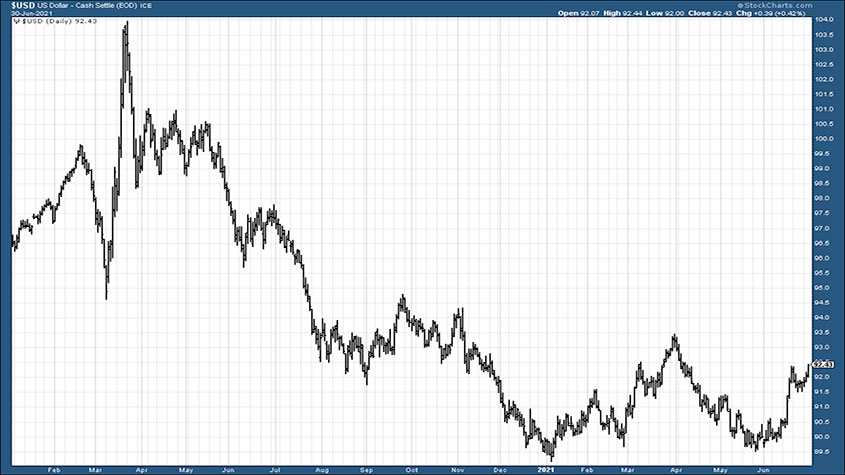
Those forex traders who trade by patterns will be all over this, and those who follow trends will be starting to join them. The implication is that it goes higher – probably to the high 90s (this is an 18-month chart, by the way).
Note that the May low for the US dollar was slightly higher than the January low – the right hand side of the W (the double bottom) – is slightly higher than the left. The pattern guys will be loving that.
We have been warning for some time on these pages about the 89 area on the US dollar index. If it doesn’t hold, then the dollar probably goes to the low 80s, maybe lower. Gold goes to $2,500 an ounce or more, bitcoin to $100,000, oil goes to $150 a barrel, and metals go to the planets – the moon, Jupiter, Mars et al – whence they came.
However, if that 89 area holds, then the inflationary trend of the last year or so that we’ve seen in commodities comes to an abrupt halt. That 89 area has held.
And meanwhile, the bull market in commodities has – oil aside – come to a juddering halt. Precious metals, base metals, softs and grains – they are all now in intermediate downtrends.
The yen, the euro, the pound and the Canadian dollar have all turned down too.
The trend is your friend. Don’t ignore it.
Oil is laughing in the face of the stronger dollar
One inflationary asset is not having it, however: oil. Rising US dollar or not, oil is grinding higher. It is in a bull market. Be long oil.
Oil demand is rising. We keep banging the drum about it on these pages. The green energy revolution needs a lot of oil to make it happen. Meanwhile, government policy dramatically disincentivises investment in oil exploration and development. What’s the result? Higher oil prices. Everybody pays. The poor are hit hardest.
Let’s spell it out in case there’s any doubt: the green energy revolution is driving the oil price higher. Government policy is driving the oil price higher. We are in the realm of unintended consequences, where government policy reigns supreme.
When oil goes above $100 – next year, probably – “greedy oil companies” will get the blame. The fault lies with deluded policy.
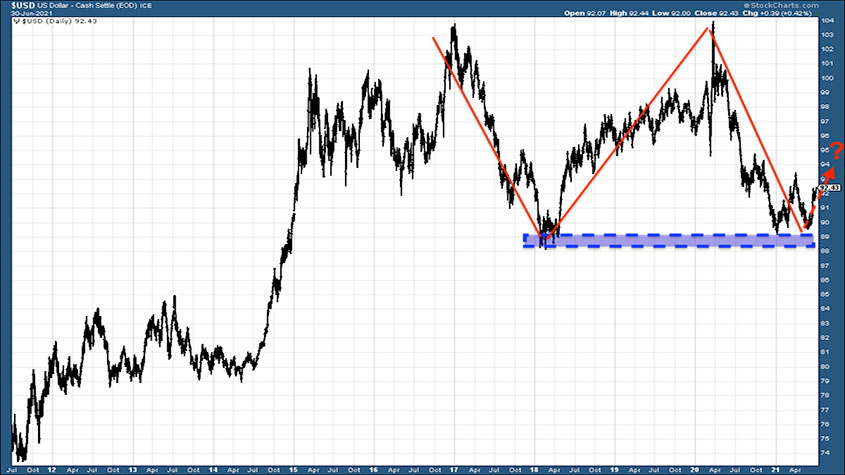
But back to the focus of today’s Money Morning – Uncle Sam’s currency. Now we zoom out and consider a longer term chart. This is the US dollar index over the last ten years. And we note, in the blue shaded area, that support zone at 88-89 was also visited in 2018. And that a much longer-term W could be forming (as drawn in red).
Is this something to be concerned about?
Possibly. The pattern recognition purists will say that a classic double bottom needs to come at the end of a downtrend. This multi-year double bottom came after an uptrend. That doesn’t rule out the scenario that this a multi-year W, but it is not as clear-cut as the shorter-term pattern with which we began this article.
In fact, more clean-cut is the double top – the “M” top around 104 – which heralds lower prices.
Ah, technical analysis is in the eye of the beholder.
A more likely scenario over the longer term perhaps is that we range trade. Perhaps we get runaway inflation and commodity prices in non-US-dollar currencies, while the US dollar sees an influx.
Impossible to know. But in the shorter term – and by that I mean the next few months – it looks like the US dollar wants to go up.
Daylight Robbery – How Tax Shaped The Past And Will Change The Future is now out in paperback at Amazon and all good bookstores with the audiobook, read by Dominic, on Audible and elsewhere.
Get the latest financial news, insights and expert analysis from our award-winning MoneyWeek team, to help you understand what really matters when it comes to your finances.

-
 Average UK house price reaches £300,000 for first time, Halifax says
While the average house price has topped £300k, regional disparities still remain, Halifax finds.
-
 Barings Emerging Europe trust bounces back from Russia woes
Barings Emerging Europe trust has added the Middle East and Africa to its mandate, delivering a strong recovery, says Max King
-
 Why you should keep an eye on the US dollar, the most important price in the world
Advice The US dollar is the most important asset in the world, dictating the prices of vital commodities. Where it goes next will determine the outlook for the global economy says Dominic Frisby.
-
 What is FX trading?
What is FX trading and can you make money from it? We explain how foreign exchange trading works and the risks
-
 The Burberry share price looks like a good bet
Tips The Burberry share price could be on the verge of a major upswing as the firm’s profits return to growth.
-
 Sterling accelerates its recovery after chancellor’s U-turn on taxes
News The pound has recovered after Kwasi Kwarteng U-turned on abolishing the top rate of income tax. Saloni Sardana explains what's going on..
-
 Why you should short this satellite broadband company
Tips With an ill-considered business plan, satellite broadband company AST SpaceMobile is doomed to failure, says Matthew Partridge. Here's how to short the stock.
-
 It’s time to sell this stock
Tips Digital Realty’s data-storage business model is moribund, consumed by the rise of cloud computing. Here's how you could short the shares, says Matthew Partridge.
-
 Will Liz Truss as PM mark a turning point for the pound?
Analysis The pound is at its lowest since 1985. But a new government often markets a turning point, says Dominic Frisby. Here, he looks at where sterling might go from here.
-
 Are we heading for a sterling crisis?
News The pound sliding against the dollar and the euro is symbolic of the UK's economic weakness and a sign that overseas investors losing confidence in the country.