Currency Corner: the New Zealand dollar vs the Japanese yen
The New Zealand dollar - or "kiwi" – has been sliding against the Japanese yen for years now. Dominic Frisby looks to see where it might go next.

Get the latest financial news, insights and expert analysis from our award-winning MoneyWeek team, to help you understand what really matters when it comes to your finances.
You are now subscribed
Your newsletter sign-up was successful
Want to add more newsletters?

Twice daily
MoneyWeek
Get the latest financial news, insights and expert analysis from our award-winning MoneyWeek team, to help you understand what really matters when it comes to your finances.

Four times a week
Look After My Bills
Sign up to our free money-saving newsletter, filled with the latest news and expert advice to help you find the best tips and deals for managing your bills. Start saving today!

In Currency Corner this week I thought I'd do something similar to last week pluck a currency pair at random and see where it takes us.
So, for no other reason than that they are two of the most distant currencies from the UK geographically, I'm going to look at the New Zealand dollar (the "kiwi") and the Japanese yen.
These are two currencies that I hardly track. The beauty of that is that I carry no bias into my analysis. It is based on price action and price action alone.
MoneyWeek
Subscribe to MoneyWeek today and get your first six magazine issues absolutely FREE

Sign up to Money Morning
Don't miss the latest investment and personal finances news, market analysis, plus money-saving tips with our free twice-daily newsletter
Don't miss the latest investment and personal finances news, market analysis, plus money-saving tips with our free twice-daily newsletter
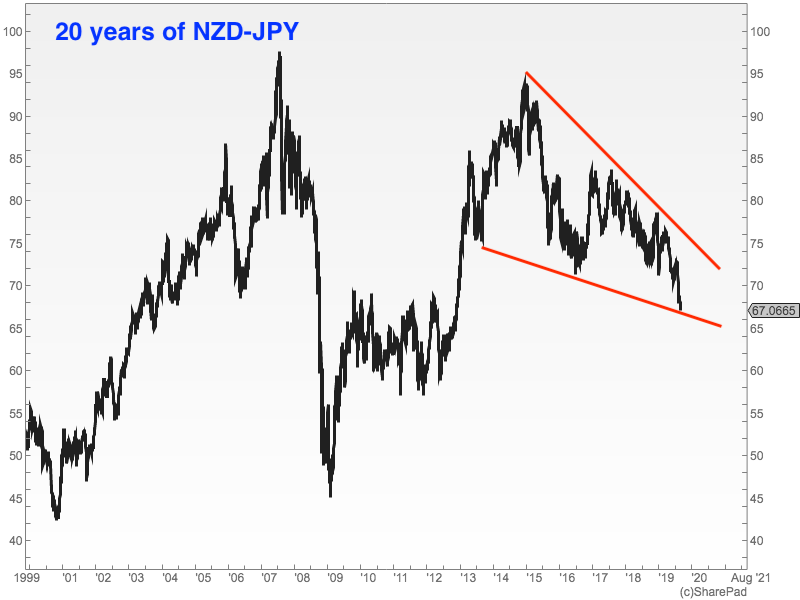
So let's start with a very long-term chart for context. Here we see ten years of Kiwi dollar/yen action.

Note: this is how many yen there are to the Kiwi dollar. So when the chart is falling, the yen is strengthening, as there are fewer yen to the dollar. (For clarity's sake whenever I say dollar now in this piece, I'm talking about the New Zealand dollar not any of the more celebrated imposters).
Straight away you can see how this pair tends to trend in one direction for many years.
The low for the dollar (or alternatively, the high for the yen) came at the turn of the century at around about 43. We then got a seven-year bull market in the dollar, that took us all the way to 20-year highs at 96 in 2007.
The financial crisis came in 2008, and the Kiwi dollar collapsed with it. Those seven years of gains were given back in less than two, and in 2009 the dollar hit a low of 46.
It's worth noting, by the way, that the peak in this pair came in July 2007 (which marked the point when the credit crunch kicked off in earnest, a prelude to the events of 2008). I remember that month very clearly for an article in The Times, in which James Harding described a test match at Lords, in which the crowd had been "gripped by a communal sense of the jitters".
July 2007 was the beginning of the end and this pair clearly marked that.
Given the remarkable soothsaying qualities this currency pair would appear to have, perhaps we should follow it more closely.
So what is the yen/kiwi pair saying now?
From 2009 we got another multi-year bull trend in the Kiwi dollar which took us to 2015 and 93 slightly lower than the 2007 peak.
Since then the trend has been down. The yen has been strengthening. We are some four-and-a-half years into a trend that seems to be pointing lower, and sits currently somewhere in the middle of that 20-year range at 67.
I have defined that trend with the red lines on the chart above. That would be what is known as a "falling wedge" pattern.
A break out of, and above, the falling wedge pattern is supposed to be bullish, but we are a long way from that. We are at the bottom of the range not the top, so the wedge is a long way from being complete.
In any case, I have, over the years, never set too much store by wedges. I have found them to be unreliable. If there are any wedge fans in the readership, I apologise for the slur.
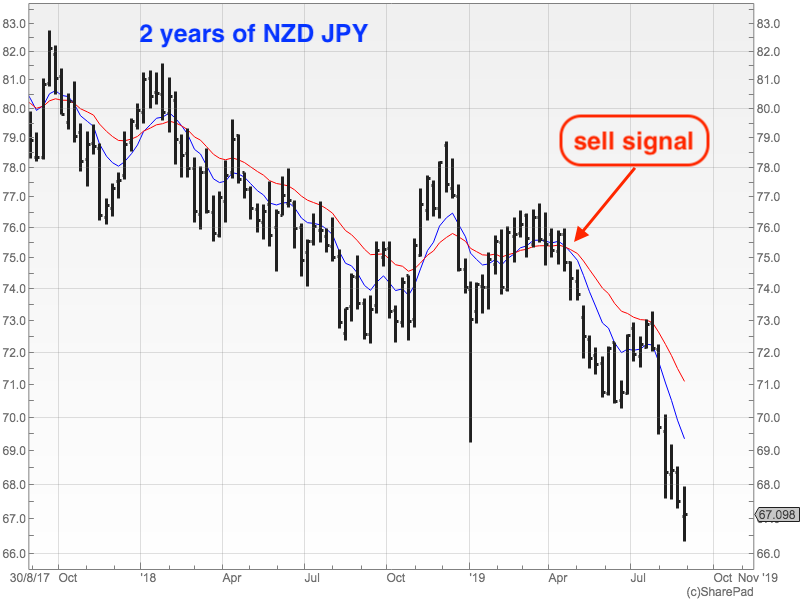
Zooming in to a two-year chart, we can see that the trend is very much down.

The price is pointing down, and the moving averages are sloping down as well. The latest in a long line of sell signals came in April (if you want to understand in detail why this was a sell signal, you can read about my trend-following system here).
So, currently, we are on a sell signal. But the market is so extended that I would be cautious about selling the dollar here. If anything, I would bet against the trend and a rally back to 70 or 72. But that would be going against the trend which is a dangerous thing to do in forex.
That said, another reason not to sell, is that this pair has proved choppy in the past in the 60s.
All in all, I would file this under "watch this space" look to sell rallies rather than an immediate must-sell-now trade.
But one thing's for sure: the yen is in a bull market and the Kiwi dollar is in a bear market. That's your bottom line.
Get the latest financial news, insights and expert analysis from our award-winning MoneyWeek team, to help you understand what really matters when it comes to your finances.

-
 Can mining stocks deliver golden gains?
With gold and silver prices having outperformed the stock markets last year, mining stocks can be an effective, if volatile, means of gaining exposure
-
 8 ways the ‘sandwich generation’ can protect wealth
People squeezed between caring for ageing parents and adult children or younger grandchildren – known as the ‘sandwich generation’ – are at risk of neglecting their own financial planning. Here’s how to protect yourself and your loved ones’ wealth.