The charts that matter: the rush to safety
The now infamous yield curve inverted this week, and that's sent investors running for cover. John Stepek looks at the charts that most most to investors to see how the markets have reacted.

Get the latest financial news, insights and expert analysis from our award-winning MoneyWeek team, to help you understand what really matters when it comes to your finances.
You are now subscribed
Your newsletter sign-up was successful
Want to add more newsletters?

Twice daily
MoneyWeek
Get the latest financial news, insights and expert analysis from our award-winning MoneyWeek team, to help you understand what really matters when it comes to your finances.

Four times a week
Look After My Bills
Sign up to our free money-saving newsletter, filled with the latest news and expert advice to help you find the best tips and deals for managing your bills. Start saving today!
Welcome back. No podcast this week we should hopefully be back to normal service next week.
Meanwhile, if you're in Edinburgh this month and you'd like to hear the closest thing to the podcast live, then get yourself over to Panmure House for an hour's chat about what's going on in the world with Merryn and guests. I'm going to be there next Thursday and Friday it'd be great to see some of you.
If you missed any of this week's Money Mornings, here are the links you need:
MoneyWeek
Subscribe to MoneyWeek today and get your first six magazine issues absolutely FREE

Sign up to Money Morning
Don't miss the latest investment and personal finances news, market analysis, plus money-saving tips with our free twice-daily newsletter
Don't miss the latest investment and personal finances news, market analysis, plus money-saving tips with our free twice-daily newsletter
Monday: How negative interest rates could spell the death of cash
Tuesday: A beginner's guide to Adam Smith, part II
Wednesday: Why you need a plan for when the market panics
Thursday: What is a yield curve, and why should I care if it inverts?
Friday: Investors are in the grip of panic don't join them
Currency Corner: Hard times are coming for emerging market currencies
Subscribe: Get 12 issues of MoneyWeek for £12
And if the recent market turmoil has you feeling punch drunk, may I recommend my book, The Sceptical Investor. There's a lot about investor psychology and plenty of tips on how to make sure you don't fall prey to your worst instincts while investing.
Right time for the charts. The big news this week is that the particular part of the yield curve that we watch finally (if briefly) inverted.
You can find out why that matters here (I've been writing about it all week!), but in short, it's a pretty reliable indicator that a recession is coming our way. On the other hand, it could be up to two years before it gets here, judging by the historic record.
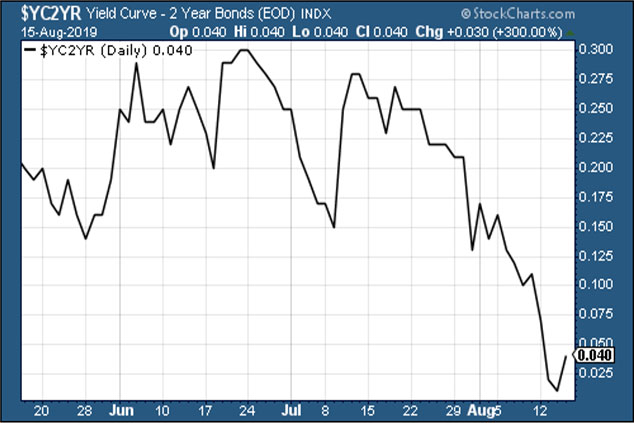
(The gap between the yield on the ten-year US Treasury and that on the two-year, going back three months)
Gold (measured in dollar terms) is heading higher alongside bond prices, which is unusual, but understandable in the circumstances, as we pointed out yesterday.
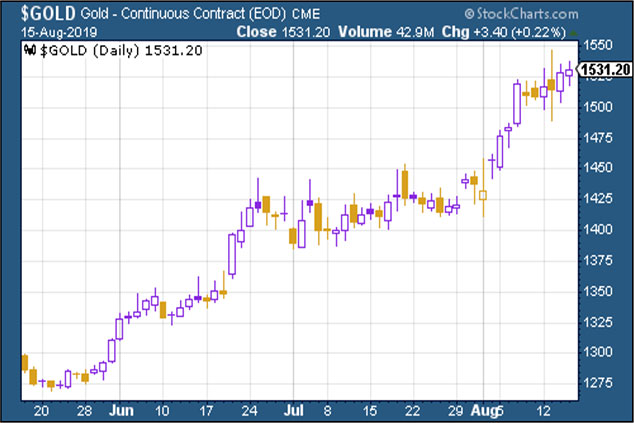
(Gold: three months)
The US dollar index a measure of the strength of the dollar against a basket of the currencies of its major trading partners continued to look solid this week. Again, it's unusual to see the dollar and gold rally at the same time, but given the dash to safety, it's understandable.
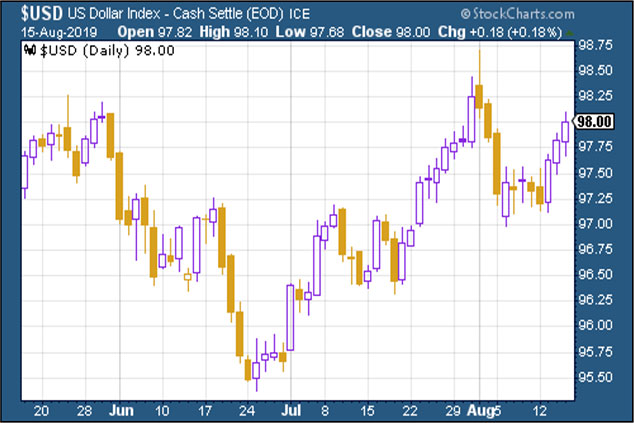
(DXY: three months)
And as to the number of Chinese yuan (or renminbi) you can get to the US dollar (USDCNY)? The Chinese are clearly comfortable with staying on the weak side of the 7.0 level that everyone had viewed as a line in the sand, although the yuan, in fact, strengthened a little this week.
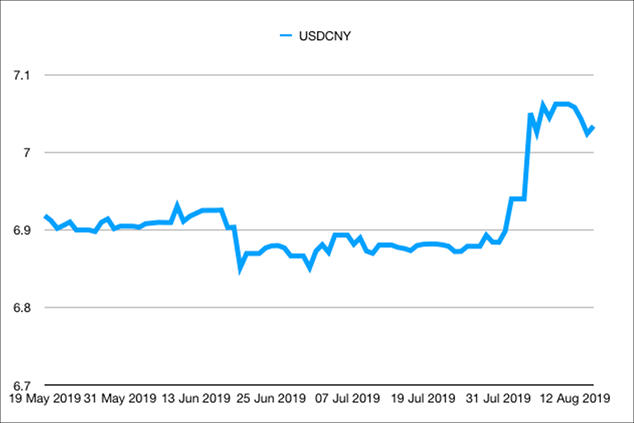
(Chinese yuan to the US dollar: three months)
Ten-year yields on major developed-market bonds just kept falling as the market makes a mad dash for "safety". Below we see the US ten-year Treasury yield.
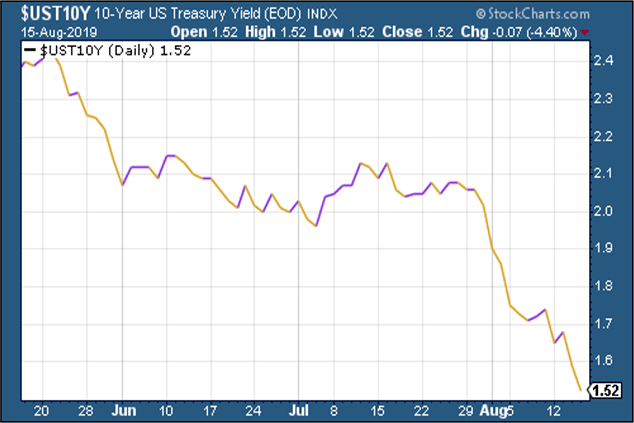
(Ten-year US Treasury yield: three months)
And then there's Japan, heading deeper into negative territory:
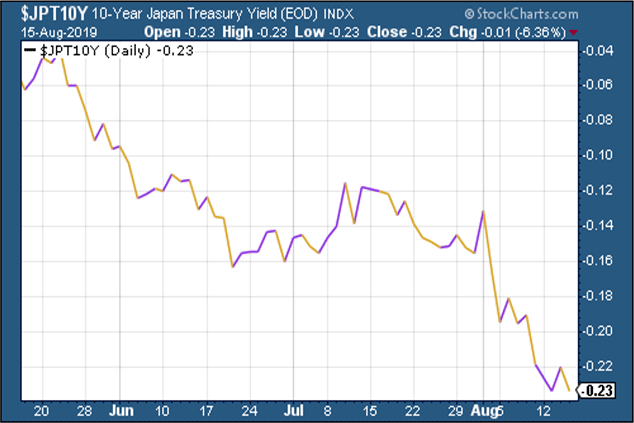
(Ten-year Japanese government bond yield: three months)
And finally, Germany, hit yet another record low as the signs all point to a recession in the eurozone's biggest economy:
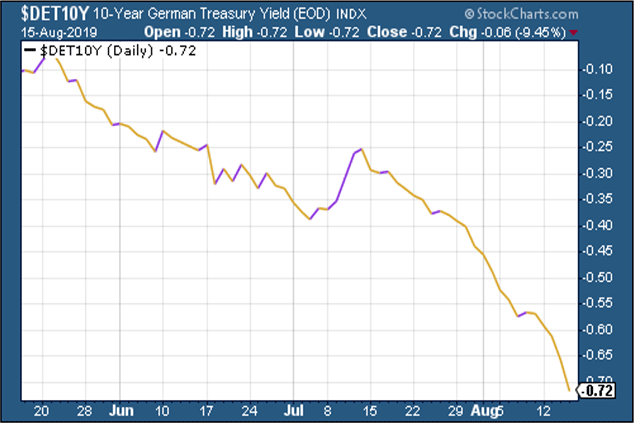
(Ten-year Bund yield: three months)
Copper is still not telling a happy story about growth, but it's worth keeping an eye on for signs that, for example, China is trying to stimulate its economy.
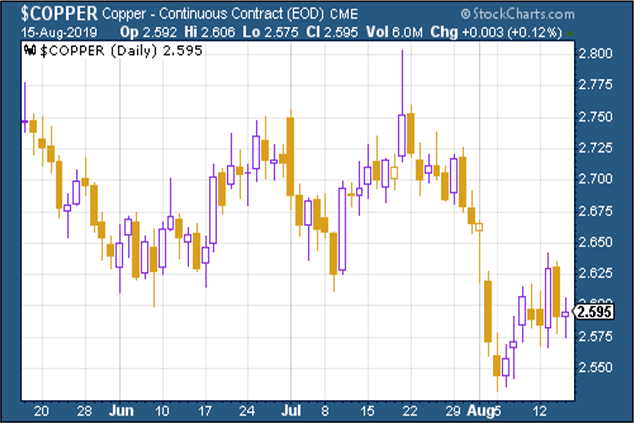
(Copper: three months)
The Aussie dollar stabilised somewhat after a tough few weeks.
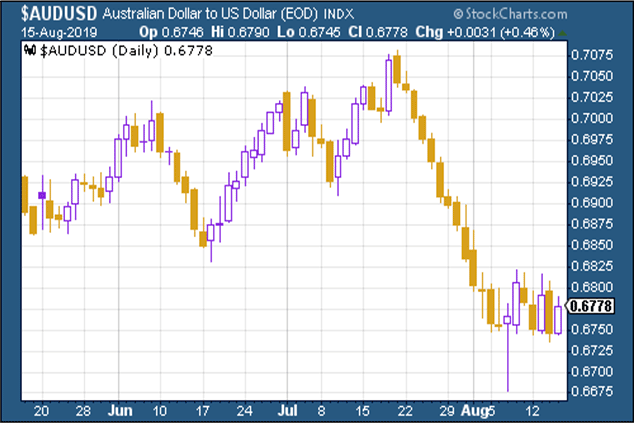
(Aussie dollar vs US dollar exchange rate: three months)
Cryptocurrency bitcoin has had a tougher week despite the panic in the markets. There was talk of another scam causing the drop but chances are it's just bitcoin being bitcoin.
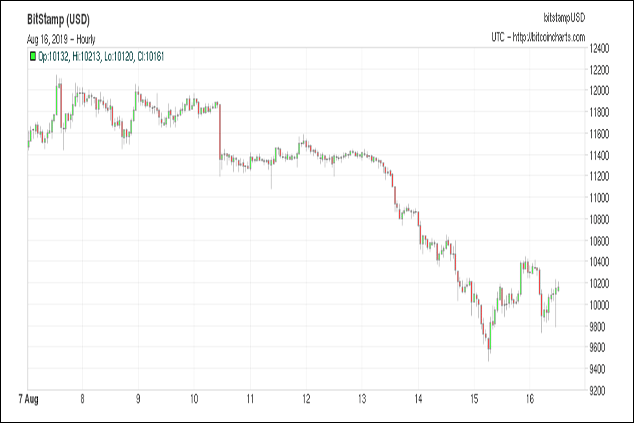
(Bitcoin: ten days)
US weekly jobless claims came in at 220,000, a bit higher than expected, while the four-week moving average edged higher to 213,750.
US stocks typically don't peak until after this four-week moving average has hit a low for the cycle, and a recession tends to follow about a year later (remember that this is not scientific it's a tiny sample size, originally highlighted by David Rosenberg at Gluskin Sheff).
The last low came about three months ago, at around 201,000. With the yield curve inverting, it's looking more and more likely to me that we won't see another trough and that we're on the start of the road towards recession now.
I've been writing all week about what that means for stocks (long story short, less than you think). But the main thing to remember is, don't panic.
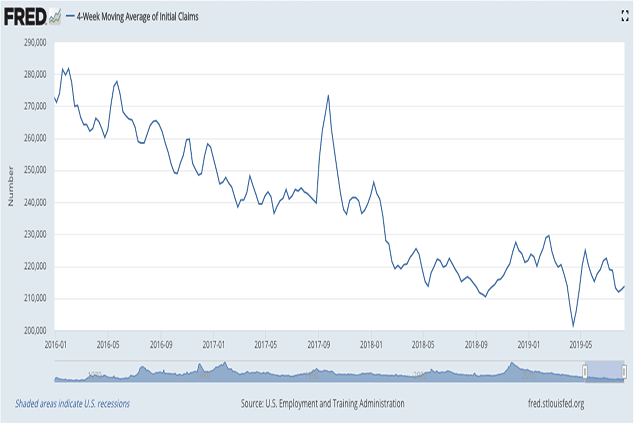
(US jobless claims, four-week moving average: since January 2016)
The oil price (as measured by Brent crude, the international/European benchmark) bounced, then fell back again. Concerns over a global slowdown have hit the oil price, but it's worth noting that the supply picture isn't especially healthy.
As James Ferguson of the Macro Strategy Partnership noted in a recent research piece, a market that seems to be beating on a deflationary world looks unusually vulnerable if oil prices end up surprising on the upside. (More on this in the latest issue of MoneyWeek, out yesterday if you're not already a subscriber, get your first 12 issues for just £12 here.)
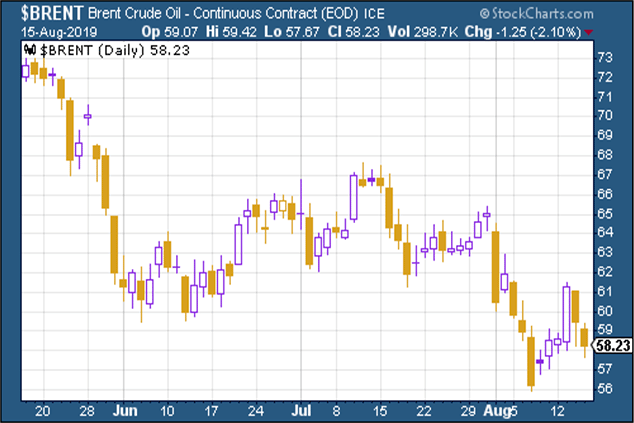
(Brent crude oil: three months)
Internet giant Amazon had a ropey week along with the rest of the market. One interesting news point on this front, however, was that Amazon's bricks'n'mortar rival Walmart made big gains this week as it forecast an overall 35% jump in online sales for 2019, and second quarter results beat hopes, both in terms of profits and sales growth.
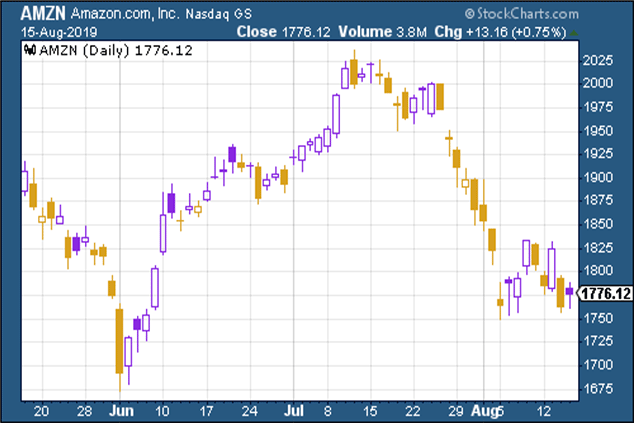
(Amazon: three months)
And once again, electric car group Tesla followed the market lower.
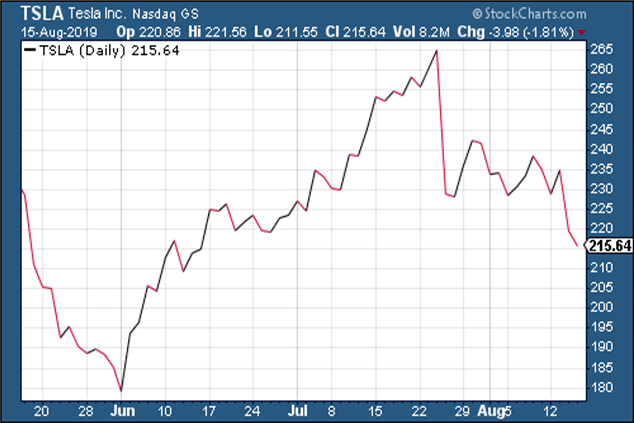
(Tesla: three months)
Just before I go, don't forget to get your ticket for the MoneyWeek Wealth Summit in London on November 22nd!
Get the latest financial news, insights and expert analysis from our award-winning MoneyWeek team, to help you understand what really matters when it comes to your finances.

-
 Barings Emerging Europe trust bounces back from Russia woes
Barings Emerging Europe trust has added the Middle East and Africa to its mandate, delivering a strong recovery, says Max King
-
 How a dovish Federal Reserve could affect you
Trump’s pick for the US Federal Reserve is not so much of a yes-man as his rival, but interest rates will still come down quickly, says Cris Sholto Heaton