The charts that matter: is there one last gasp left in the bull market?
John Stepek looks to the global economy’s most important charts to if they can shed any light on the direction of the world’s markets.

Get the latest financial news, insights and expert analysis from our award-winning MoneyWeek team, to help you understand what really matters when it comes to your finances.
You are now subscribed
Your newsletter sign-up was successful
Want to add more newsletters?

Twice daily
MoneyWeek
Get the latest financial news, insights and expert analysis from our award-winning MoneyWeek team, to help you understand what really matters when it comes to your finances.

Four times a week
Look After My Bills
Sign up to our free money-saving newsletter, filled with the latest news and expert advice to help you find the best tips and deals for managing your bills. Start saving today!
Welcome back. We have a new podcast this week Merryn tells me all about going to see popular Canadian psychologist Jordan Peterson (who wrote the best-selling 12 Rules for Life) in Edinburgh, and we both talk about the Budget and the state of politics today.
And if you missed any of this week's Money Mornings, here are the links you need.
Monday: Here's what to expect from today's Budget
MoneyWeek
Subscribe to MoneyWeek today and get your first six magazine issues absolutely FREE

Sign up to Money Morning
Don't miss the latest investment and personal finances news, market analysis, plus money-saving tips with our free twice-daily newsletter
Don't miss the latest investment and personal finances news, market analysis, plus money-saving tips with our free twice-daily newsletter
Tuesday: The message from the Budget: this one's for the little people
Wednesday: What I've been doing with my own money and what that says about markets
Thursday: Investors are finally losing interest in UK housing
Friday: This deal could eventually mark the top of the market watch it closely
Also don't miss Merryn's pieces on robots and housebuilding; the risks to investors now that markets are waking up from a pleasant but hollow central bank-induced dream; and why allowing people to access their pensions early is a stupid idea.
Lastly, don't miss this week's issue of MoneyWeek magazine if you're not already a subscriber, sign up here now.
And now over to the charts.
October, clearly, was a scary month for investors. And yesterday's news on the US economy might not make things much easier for them. The latest non-farm payrolls report was strong. The US economy added a quarter of a million jobs, the unemployment rate came in at 3.7%, and wages rose by 3.1% on last year.
That's punchy. That makes it hard to believe (as investors were starting to hope) that the Federal Reserve will go easy on raising interest rates. With that in mind, let's take a look at the charts of the week.
Gold (measured in dollar terms) has turned a corner somewhat in the last couple of weeks. As we tend to point out, you own gold in your portfolio because it often (if not always) goes up when most other things are going down. Whether the good news for gold can continue for the time being in the face of healthy US economic news depends on how investors react to the news.
Firstly, they might assume that the Fed will continue raising rates. That would normally be bad for gold, but there is the possibility that investors will be so rattled by the idea of rising rates that they will want to continue to hold "safe havens", just in case.
Secondly (and I think this is more of a longer-term issue), investors might start to believe that the Fed will fall behind the inflation curve. That would also be good for gold as it would mean that "real" interest rates fall. It will take a few more punchy readings before that happens though.
The US dollar index a measure of the strength of the dollar against a basket of the currencies of its major trading partners fell back from its recent highs this week, primarily because it had risen too far. Whether this marks a longer-term peak or not will be vital for whether this equity bull market has one last gasp of fun left in it.
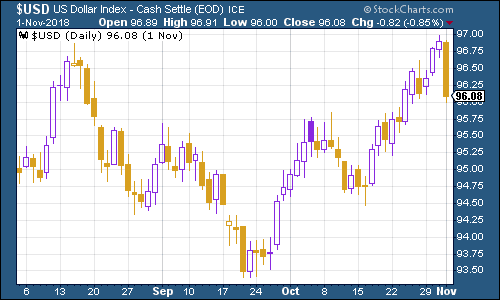
(DXY: three months)
The yield on the ten-year US Treasury bond remained off its highs but as I said before, it's interesting to see such a jittery market combined with a relatively low appetite for bonds.
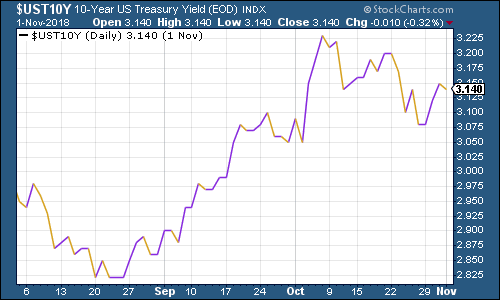
(Ten-year US Treasury yield: three months)
The Japanese government bond (JGB) yield has fallen back more significantly.
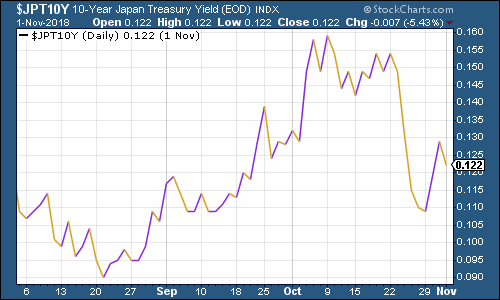
(Ten-year Japanese government bond yield: three months)
Meanwhile in Europe, the yield on the ten-year German bund (the borrowing cost of Germany's government, Europe's "risk-free" rate) recovered from recent lows. Investors are still distracted by turmoil in Italy, but we now also have the resignation of Angela Merkel as German chancellor. She doesn't plan to step down before her term is up (so technically this isn't a big surprise no one would have expected her to run yet again). But with her position seriously weakened, will she stick around?
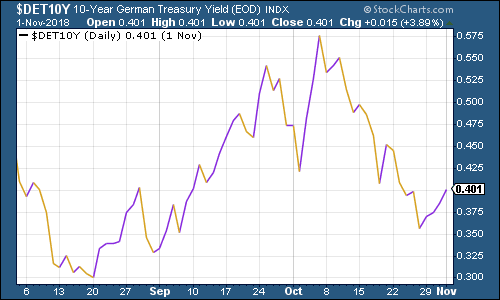
(Ten-year bund yield: three months)
Copper rallied somewhat this week, at least partly due to the dollar weakening.
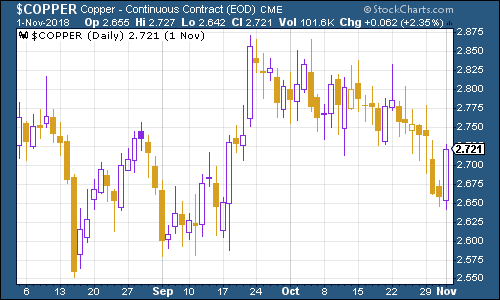
(Copper: three months)
Cryptocurrency bitcoin remains in the same listless state that it's been in all month.
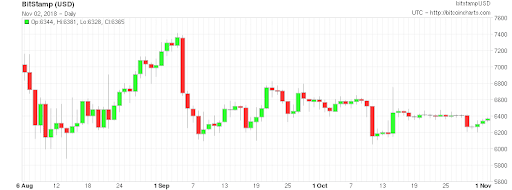
(Bitcoin: three months)
On US employment, the four-week moving average of weekly US jobless claims stayed close to its cycle low this week, although it is rising it came in at 213,750. Meanwhile weekly claims came in at 214,000.
As David Rosenberg of Gluskin Sheff has noted in the past, the stockmarket usually does not hit its peak until after we've seen jobless claims (as measured by the 14-week moving average) hit rock bottom for a cycle.
Based on a small number of observations (which means you should take the exact figures with a pinch of salt, because they're not statistically significant as such, just interesting to look at), the stockmarket peak usually follows about 14 weeks from when jobless claims hit the bottom, and a recession follows about a year later.
In other words, even if we've already hit rock bottom for this cycle which would have been mid-to-late September then we should still be at least a year away from recession as yet, and likely a few months away from a stockmarket peak. If mid-September really was the bottom, then that would imply a market peak around late December, or the start of next year.
Intriguingly, that's around about when SoftBank's mobile phone unit IPO is due. Coincidence? Hmmm.
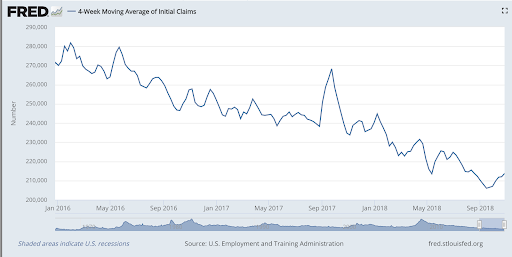
(US jobless claims, four-week moving average: since January 2016)
The oil price (as measured by Brent crude, the international/European benchmark) continued to fall, despite the imposition of tighter sanctions on Iran. What does this show you? Honestly, the fact that oil plunged with markets in October shows that a lot of what drives oil is what's going on in other financial markets and the level of exuberance felt by traders. You can look at the supply and demand data all you want and it'll give you an idea of what's going on at genuine turning points. But on a week-to-week basis, it's all about the market's sense of adventure (or lack of it).
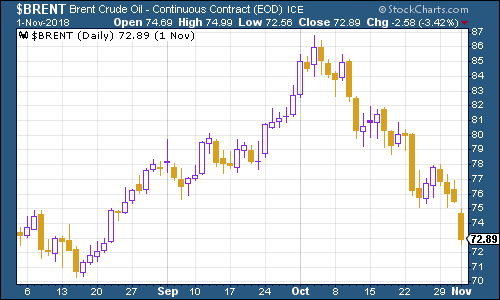
(Brent crude oil: three months)
Internet giant Amazon has started to rebound from its grim October. Keep an eye on Amazon it's the stock that you won't get fired for owning, so if we're to see a last-gasp rally in this market then Amazon will be one of the leaders, as it's a stock that if it progresses much further everyone will wish they'd bought on the dip.
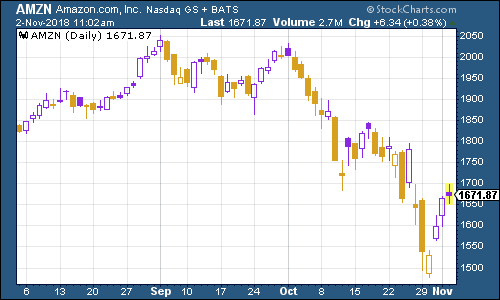
(Amazon: three months)
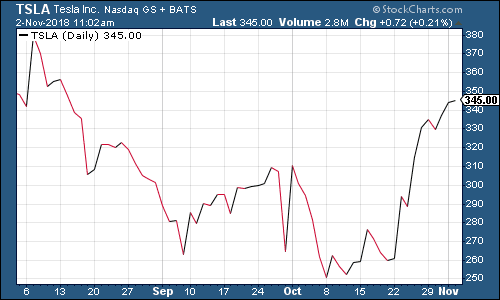
Electric-car group Tesla is beating its own merry path as usual. And short-sellers of the stock will be licking their wounds. The company surprised everyone by posting a solid profit in its third quarter, while founder Elon Musk has managed to refrain from doing anything stupid in public for a couple of weeks now. So it looks like the bulls are back in charge of the electric dynamo for now.

(Tesla: three months)
Have a great weekend.
Get the latest financial news, insights and expert analysis from our award-winning MoneyWeek team, to help you understand what really matters when it comes to your finances.

-
 Average UK house price reaches £300,000 for first time, Halifax says
While the average house price has topped £300k, regional disparities still remain, Halifax finds.
-
 Barings Emerging Europe trust bounces back from Russia woes
Barings Emerging Europe trust has added the Middle East and Africa to its mandate, delivering a strong recovery, says Max King