The charts that matter: an anxious week for markets
Markets had a nervy week, with investors rattled by almost everything. John Stepek turns to the charts that matter to see what they can tell us.

Get the latest financial news, insights and expert analysis from our award-winning MoneyWeek team, to help you understand what really matters when it comes to your finances.
You are now subscribed
Your newsletter sign-up was successful
Want to add more newsletters?

Twice daily
MoneyWeek
Get the latest financial news, insights and expert analysis from our award-winning MoneyWeek team, to help you understand what really matters when it comes to your finances.

Four times a week
Look After My Bills
Sign up to our free money-saving newsletter, filled with the latest news and expert advice to help you find the best tips and deals for managing your bills. Start saving today!
Welcome to your weekend edition, where we take a look through the charts that matter and catch up on anything else that we missed during the week.
Markets had a bit of a nervy week. Investors have grown slightly rattled by the junk bond market as I discussed on Monday. And the truth is that stock markets, bond markets, and most other things, are very expensive indeed (I mean, try buying an Old Master for less than half a billion these days!)
That said, this could just be a breather. Markets have had a fair old run at things and one of the reasons that junk has dropped off a bit is that it had simply hit a high. One of the features of this market is that new highs have become so commonplace and there has been such a notable near-absence of significant pullbacks, that even a small sustained dip is enough to get people eyeing the exit door.
MoneyWeek
Subscribe to MoneyWeek today and get your first six magazine issues absolutely FREE

Sign up to Money Morning
Don't miss the latest investment and personal finances news, market analysis, plus money-saving tips with our free twice-daily newsletter
Don't miss the latest investment and personal finances news, market analysis, plus money-saving tips with our free twice-daily newsletter
The market I'm watching more than any other, as I mentioned last week is Japan's Topix index.
Jonathan Allum at broker SMBC Nikko describes the 1,800 level on the Topix as "the iron coffin lid". Ever since the crash of the early 1990s, the Japanese stockmarket has failed to break through this level, despite challenging it on several occasions.
In fact, the chart below shows what happened the last time the Topix was challenging the 1,800 level, way back in 2007.
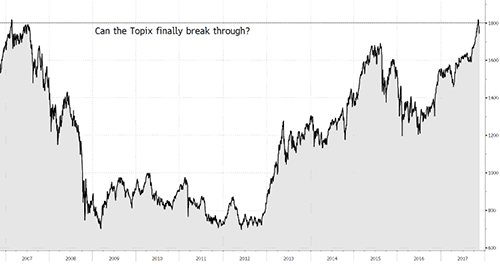
I'm a Japan bull. At the same time, I recognise that with markets around the world looking rather expensive, then if there's a time for everyone to panic, then it wouldn't be out of character for it to happen now. You can be as bullish as you like on Japan, but if the US market and others start falling it'll probably fall too.
Then again, a convincing breakout here would be very bullish indeed, as it would convince many technical traders that the only way is up for Japan. And to my mind, if Japan does manage to break out convincingly, that probably means that we've escaped the deflation threat once and for all, and the next big danger, coming down the line, is inflation.
In turn, that could sustain the bull market for longer. So as far as barometers of stock market mood go, the Topix chart is the one I'm most closely focused on right now.
And now, turning to our regular charts
Monday: Junk bond investors are getting jittery do they know something we don't?
Tuesday: The buy-to-let boom is on its last legs what happens now?
Wednesday: How to play oil's stealth bull market
Thursday: The most expensive painting in the world
Friday: Did one man trigger the Great Depression?
Gold basically trod ground this week. There are enough jitters to keep it from falling much below $1,270 per ounce, but the "buy-the-dip" mentality is still keeping investors hopeful that stocks are worth buying on every little 1% pullback.
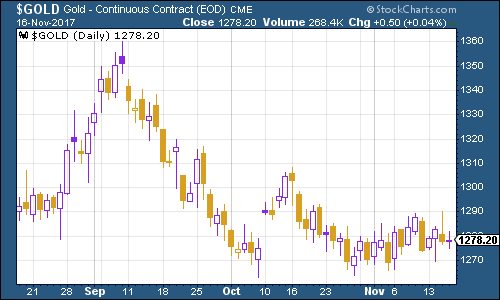
(Gold: three months)
The US dollar index a measure of the strength of the dollar against a basket of the currencies of its major trading partners had a similar week, with not a great deal of movement. Inflation data in the US didn't spring any surprises and so there wasn't much to shift the greenback one way or another.
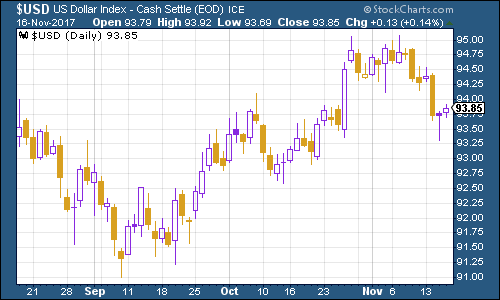
(DXY: three months)
The yield on ten-year US Treasury bonds is still in a holding pattern, and continues to hover below the 2.4% mark that's now seen as a major line in the sand by many analysts.
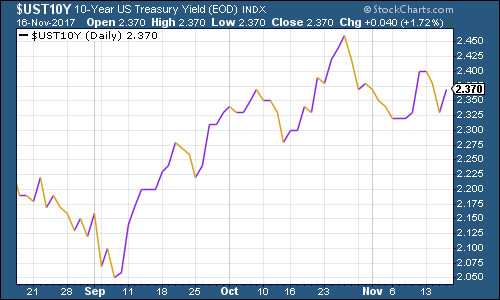
(Ten-year US Treasury: three months)
Copper took a dent again this week, although again it's still holding on above $3 a pound.
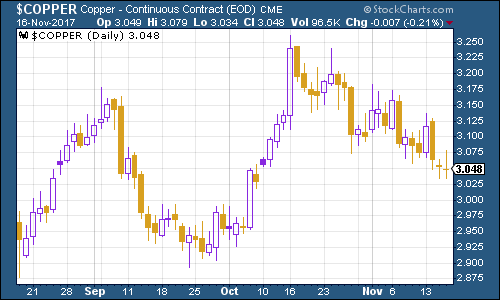
(Copper: three months)
Bitcoin had a major correction at the end of last week and over the weekend. But since then it's come back stronger than ever. You could have bought at $6,000 mid-week and have made a 30% profit by the end of the week. No wonder people are excited by this stuff.
My colleague Dominic Frisby offered up his own bull market take on bitcoin last week, sketching out scenarios that could take it to $100,000 if you missed the piece, you should check it out (and do bear in mind that Dominic was doing blue-sky thinking rather than entirely serious analysis).
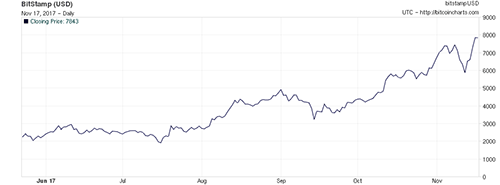
(Bitcoin: six months)
This week, weekly US jobless claims remained low. The four-week moving average moved higher, to 237,250, as claims came in at 249,000. According to David Rosenberg of Gluskin Sheff, when US jobless claims hit a "cyclical trough" (as measured by the four-week moving average), a stockmarket peak is not far behind (on average 14 weeks), a recession follows about a year later.
As the chart below shows, last week's level of 231,250 was the most recent cyclical trough (the previous one was last week, the one before on May 20th). So we could still be a way from the peak. That said, as we mentioned above, the market has seemed a lot more jittery this week than we've seen in a while.
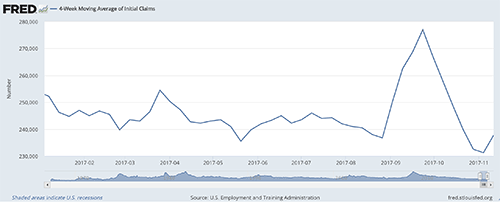
(Four-week moving average, US jobless claims, year-to-date)
The oil price (as measured by Brent crude, the international/European benchmark) finally gave up its recent strong run as concerns over Saudi Arabia were trumped by reports from the IEA (International Energy Agency) that shale would last a lot longer than anyone expects. That said, Dominic remains bullish on the oil price here he explains why.
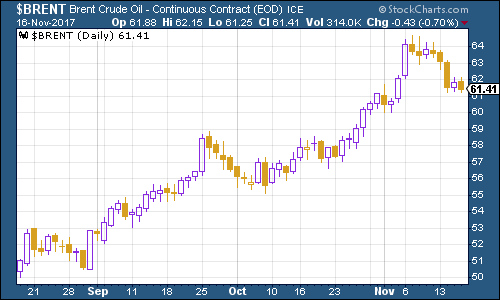
(Brent crude oil: three months)
Finally, internet giant Amazon ticked even higher this week despite wobbles in the wider market. Although interestingly, arch bricks-and-mortar rival Wal-Mart saw its shares rocket this week as it saw internet sales rise by 50% in its third quarter. The shares now trade at a record valuation.
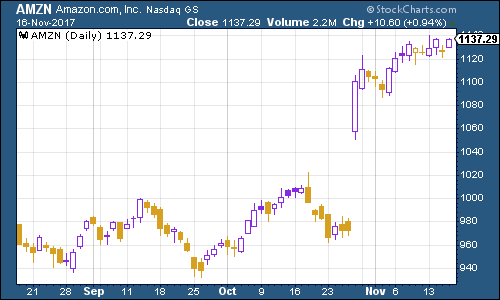
(Amazon: three months)
Get the latest financial news, insights and expert analysis from our award-winning MoneyWeek team, to help you understand what really matters when it comes to your finances.

-
 Average UK house price reaches £300,000 for first time, Halifax says
While the average house price has topped £300k, regional disparities still remain, Halifax finds.
-
 Barings Emerging Europe trust bounces back from Russia woes
Barings Emerging Europe trust has added the Middle East and Africa to its mandate, delivering a strong recovery, says Max King