What is inflation and how does it affect you?
The latest inflation figures are released each month. What is inflation and how does it impact your personal finances?


You are now subscribed
Your newsletter sign-up was successful
Want to add more newsletters?

Twice daily
MoneyWeek
Get the latest financial news, insights and expert analysis from our award-winning MoneyWeek team, to help you understand what really matters when it comes to your finances.

Four times a week
Look After My Bills
Sign up to our free money-saving newsletter, filled with the latest news and expert advice to help you find the best tips and deals for managing your bills. Start saving today!
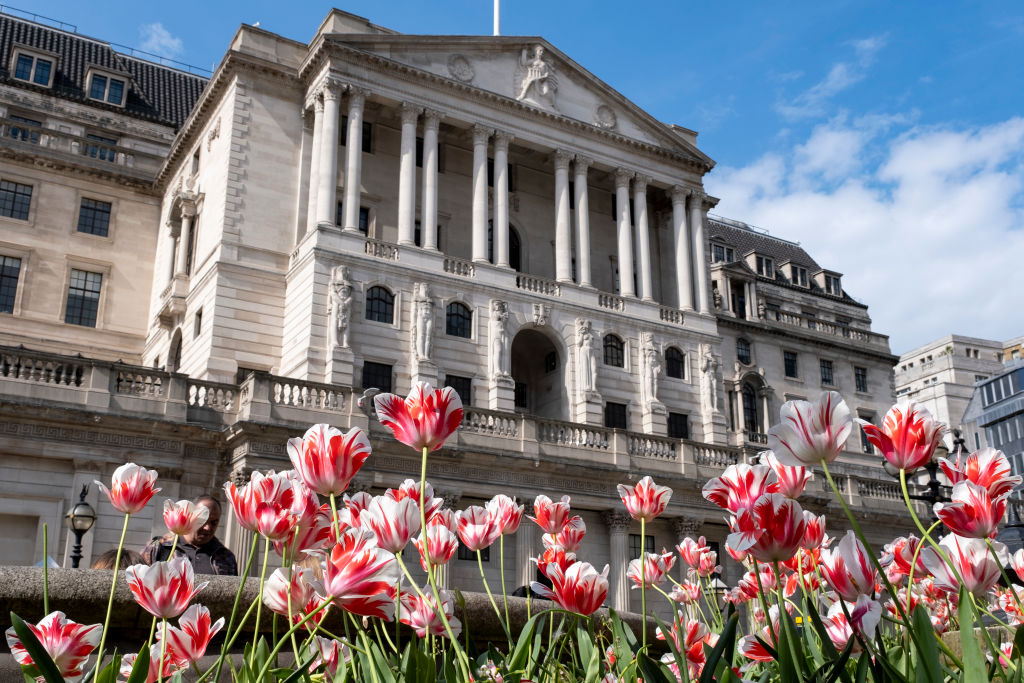
Inflation is one of the most important economic metrics that affects you and your money. There’s a good reason why the government and Bank of England look at it so closely.
Put simply, inflation measures how much the overall level of prices for goods and services consumed by households have increased in a set period of time.
The key word here is “overall”. Most people buy a very wide range of goods and services, from energy and food to books and VR headsets, and these rise and fall in price by different amounts.
MoneyWeek
Subscribe to MoneyWeek today and get your first six magazine issues absolutely FREE

Sign up to Money Morning
Don't miss the latest investment and personal finances news, market analysis, plus money-saving tips with our free twice-daily newsletter
Don't miss the latest investment and personal finances news, market analysis, plus money-saving tips with our free twice-daily newsletter
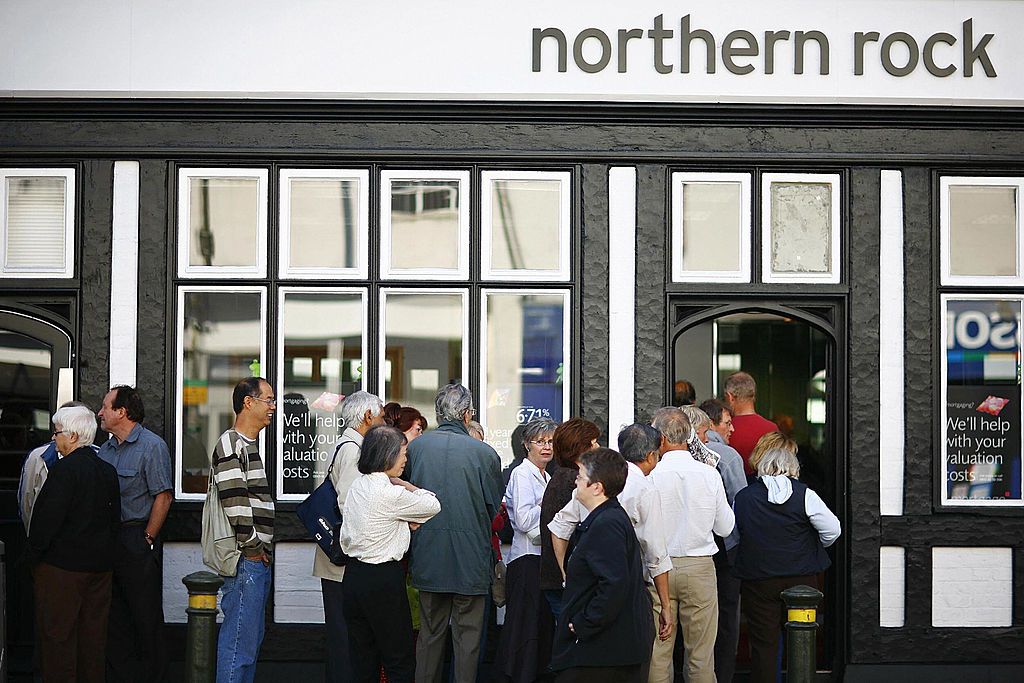
The UK’s most recent inflationary cycle began at the start of the cost of living crisis, when inflation quickly climbed from 2% in July 2021 to a peak of 11.1% in October 2022.
After falling from that high and returning to around the Bank of England’s 2% target in 2024, inflation stayed far above target for most of 2025.
What is inflation?
Inflation is a measure of how much prices have risen over a given time period. If you bought an apple for £1 in one year, but bought the same apple for £1.10 the next year, its price will have inflated by 10%.
However, this will not necessarily mean that the level of inflation in the entire economy was 10% in that year.
The apple’s price may have increased at a much faster rate than other prices, perhaps because a poor harvest meant there were too few apples for the demand of the market, causing a price increase.
Furthermore, different people do not buy the same things. You might be more likely to buy a packet of sweets than an apple, meaning you are less affected by the rising price of apples.
That is why the Office for National Statistics (ONS), the UK’s official statistics body, measures inflation by logging the prices of a wide range of things – known as its basket of goods.
This includes the prices of food, energy, clothes, hotels, train tickets, and much more. The basket is adjusted each year to make sure it accurately reflects what people are actually buying – for example, in 2025 the ONS added VR headsets to the basket of goods.
By measuring a wide range of prices, the ONS is able to get a much more holistic picture of how prices are changing across the entire economy, not just within one particular market.
Once the ONS has gathered all the prices, they will calculate the level of inflation in the economy and express it through several different indices. The most widely reported is the Consumer Prices Index (CPI). This is an internationally-recognised measure of inflation.
CPI strips out housing costs like council tax and rent payments. Other indices include these, such as the Retail Prices Index (RPI) and the Consumer Prices Index including Owner Occupiers' Housing Costs (CPIH).
Measuring inflation is a useful way of measuring how our spending power has changed over time, but it also has a real-world impact.
For example, inflation rates are used to set the amount by which rail fares and some key utility bills go up. The figure also plays a role when determining how much the state pension will increase by.
Economists believe having some inflation (for example the Bank of England's 2% target) is healthy for the economy because it encourages spending and means GDP can grow.
However, high inflation can do severe damage to living standards, as we've seen during the cost of living crisis.
Why will there be inflation in an economy?
There are a whole host of reasons why prices could be increasing in an economy.
As we saw in the apple example earlier, prices could be pushed higher because of natural causes that lead to a restriction in the supply of a good.
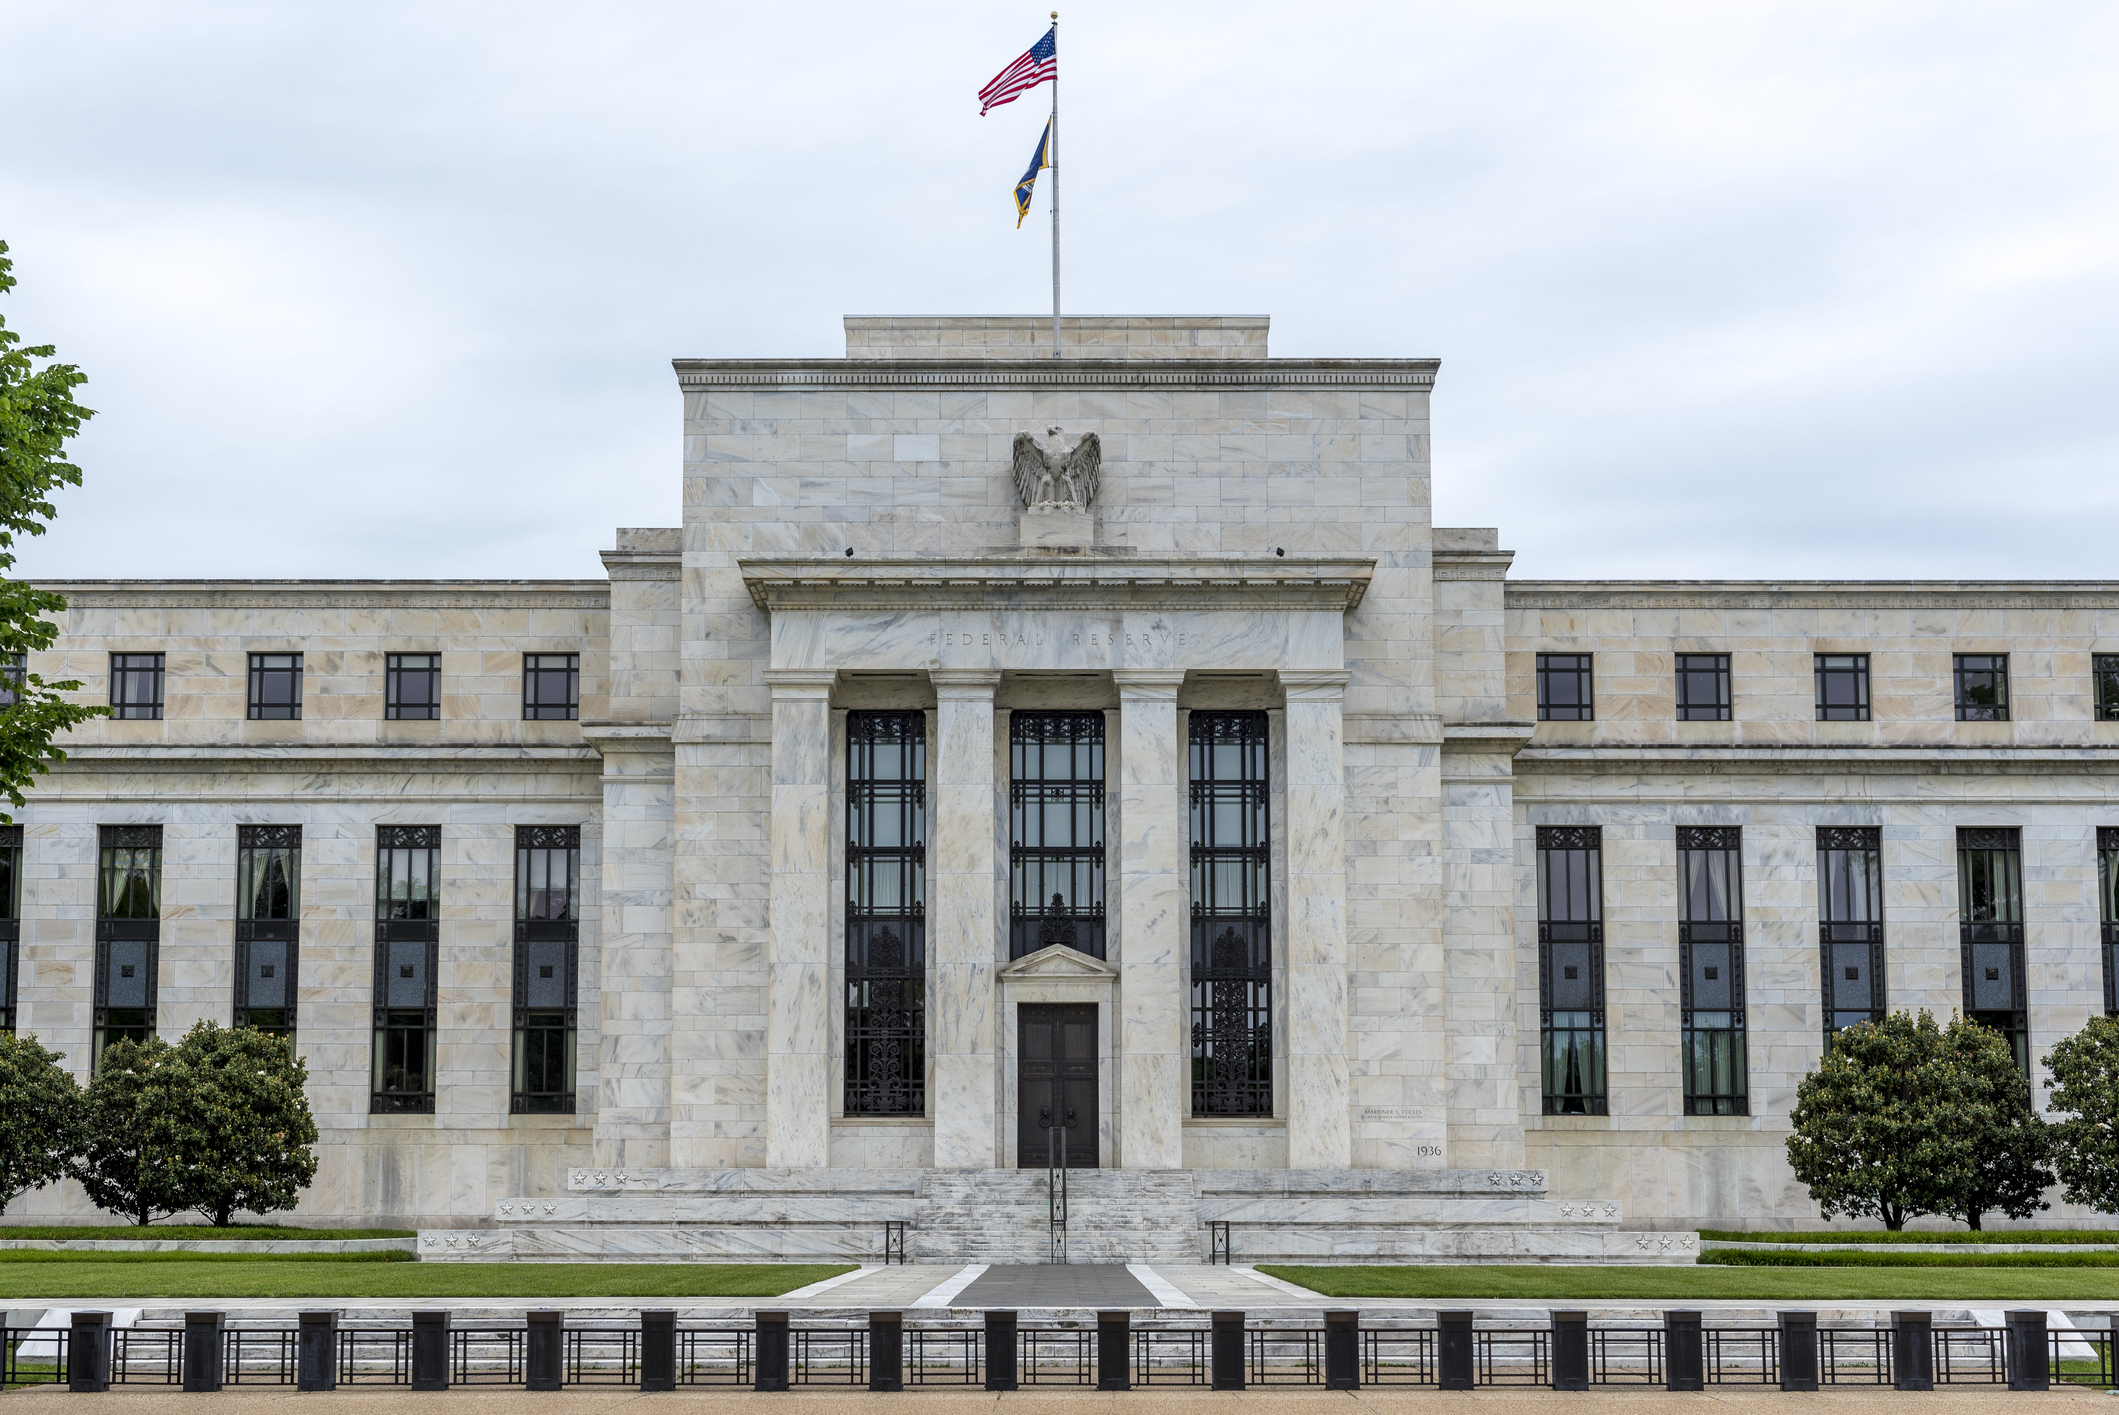
On the other hand, prices can also be artificially inflated through government actions. In the United States, prices of many imported goods have increased after Donald Trump imposed a sweeping set of tariffs (taxes paid to the government when importing a good).
On the whole, there are two main types of inflation – ‘cost-push’ and ‘demand pull’.
- Cost-push inflation: This type of inflation is caused by an increase in production costs. Imagine cocoa prices rise. This might make it more expensive for a chocolate company to produce chocolate bars. In response, the company can either produce fewer bars or put up its prices. In other words, the price of chocolate bars is pushed up by higher cocoa prices.
- Demand-pull inflation: This type of inflation happens when demand outstrips supply. A good example is what happened after the Covid lockdowns ended. Households had saved up a lot of money while they were cooped up, and used their newfound freedom as an opportunity to splurge. The surge in demand pulled prices up.
Inflation expectations can also create price pressures.
If workers think prices are going to rise rapidly, they might negotiate larger pay rises from their employers. This pushes up costs for businesses by giving them a higher wage bill.
It also gives workers more money in their pocket, making them more likely to spend. Both effects worsen the inflation cycle.
How does inflation affect you?
As mentioned earlier, inflation affects different individuals and groups to different extents. Some people will have a much higher personal inflation rate than others depending on the types of things they spend money on.
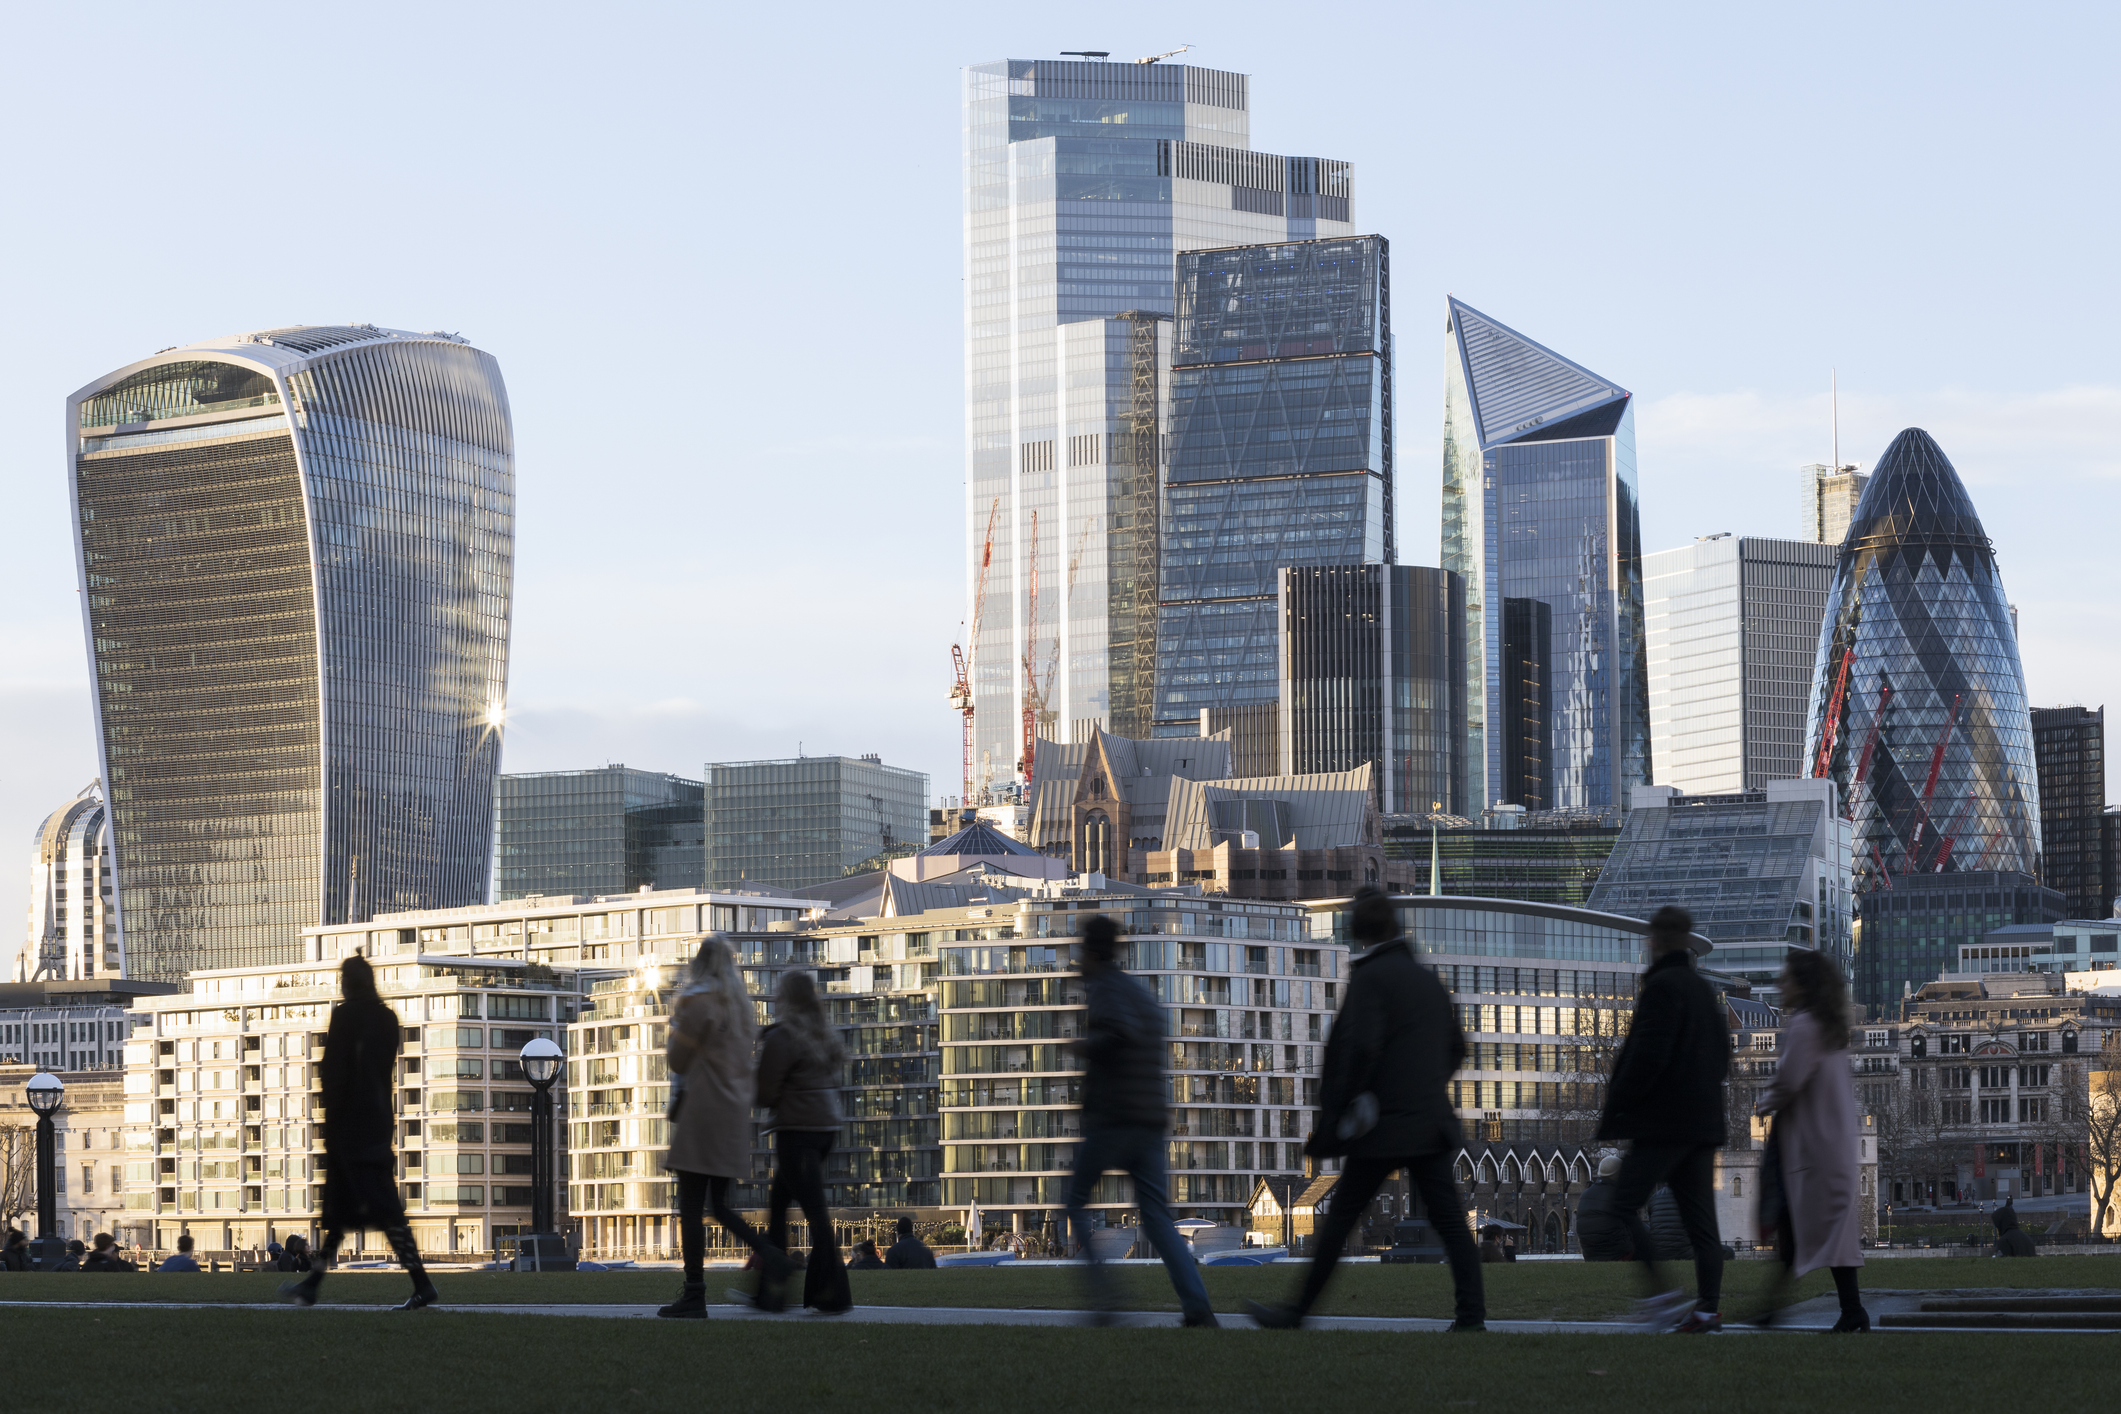
For example, a 40-year-old banker on a City of London salary is much more likely to feel the effect of the rising cost of fancy suits than a 75-year-old person reliant on the state pension.
The extent to which inflation affects the quality of your life also depends on your personal circumstances.
If the price of energy soars (as it did in 2022), the state pensioner will be spending a much higher proportion of their already stretched income to heat their home than the highly-paid banker.
But no matter who you are, price hikes will affect your budget, and may potentially reduce the number of things you can afford.
Inflation is also used by the government and businesses to set prices. Things like train fares go up in price every year depending on the inflation rate so, in theory at least, those services don't lose out from the erosion of the value of the pound.
Inflation can also work to your advantage. It's worth bearing the rate of inflation in mind when asking for a pay rise, or if you are a landlord and want to increase rents.
In your own personal finances, you will want to ensure the value of your money keeps up with or at least stays close to inflation. To achieve this, you will need to put your money into an inflation-busting savings account.
See our round-up of the best easy-access accounts, one-year savings bonds, regular saver accounts and cash ISAs.
Once you have built up sufficient cash savings, you may also want to consider investing, provided you are willing to lock the money away for at least five years to ride out short-term market volatility. Investing in a diversified portfolio of assets can be a good strategy for beating inflation.
Data from Barclays looking back over the past 120 years or so shows that equities have outperformed cash 70% of the time, based on a two-year holding period. If you extend the holding period to 10 years, it rises to 91% of the time.
We take a closer look at this topic in our beginner’s guide to investing, and in our piece on saving versus investing.
When is inflation data released?
The ONS reveals the latest inflation figures each month. Each release details the inflation rate for the previous monthly period. The data is released at 7am.
The next set of inflation data, covering January 2026, is due to be released on 18 February. For a full list of upcoming reports, see our calendar of CPI release dates.
What is the difference between disinflation and deflation?
Disinflation and deflation are two different things, and understanding the difference between them is important.
Disinflation is the process that takes place when the rate of inflation falls. In a disinflationary environment, prices are still rising, but at a slower rate than they once were.
Inflation hit 11.1% at the peak of the cost-of-living crisis, compared to 3.4% today. Prices are rising in both environments, but the rate of price increases is lower today.
Deflation refers to when prices fall over time. As enticing as deflation sounds, it is often regarded by economists as worse than inflation. It can result in reduced consumer spending, as people put off purchasing things in the knowledge prices could be lower next week, next month or next year.
This can cause the economy to slow, potentially resulting in recession and higher unemployment rates as companies lay off staff. Deflation can also make debts more challenging to pay off, as the real value of the debt goes up.
A classic example of this can be seen in the US Great Depression of 1929 to 1933, where prices fell by a third. Businesses that took on high levels of debt during the 1920s found that they were no longer able to pay back their creditors. This led to a wave of repositions and bankruptcies, throwing millions out of work.
What is stagflation?
During the recent rise in inflation in 2025, some commentators said they believed the UK was at risk of falling into a stagflationary state as GDP growth was minimal while prices kept rising.
Stagflation refers to a predicament in which economic growth is stagnant while inflation is high.
The resulting economic situation becomes challenging, as high inflation means the purchasing power of money is eroded while anaemic economic growth and unemployment mean people have less cash to spend.
The UK experienced a long run of stagflation in the 1970s when inflation reached 24.5% in August 1975. At the same time, the economy was contracting – GDP fell by 2.5% in 1974 and 1.5% in 1975.
Is Britain going to enter a similar state of stagflation in the near future? The answer is that it is probably too early to tell.
While some economic indicators (above-target inflation and low GDP growth) mirror the results you would expect from an economy about to enter stagflation, the situation is still far from being as dire as it was in the 1970s – especially considering that most economists expect inflation to trend downwards throughout 2026.
We take a closer look in our stagflation explainer.

-
 ISA fund and trust picks for every type of investor – which could work for you?
Whether you’re an ISA investor seeking reliable returns, looking to add a bit more risk to your portfolio or are new to investing, MoneyWeek asked the experts for funds and investment trusts you could consider in 2026
-
 The most popular fund sectors of 2025 as investor outflows continue
It was another difficult year for fund inflows but there are signs that investors are returning to the financial markets


-
 Why Scotland's proposed government bonds are a terrible investment
Opinion Politicians in Scotland pushing for “kilts” think it will strengthen the case for independence and boost financial credibility. It's more likely to backfire
-
 How have central banks evolved in the last century – and are they still fit for purpose?
The rise to power and dominance of the central banks has been a key theme in MoneyWeek in its 25 years. Has their rule been benign?
-
 UK to have highest inflation among advanced economies this year and next, says IMF
The International Monetary Fund (IMF) says it expects inflation to remain high in the UK, while lowering economic growth forecasts for 2026.
-
 Is Britain heading for a big debt crisis?
Opinion Things are not yet as bad as some reports have claimed. But they sure aren’t rosy either, says Julian Jessop
-
 'Britain is on the road to nowhere under Labour'
Opinion Britain's economy will shake off its torpor and grow robustly, but not under Keir Starmer's leadership, says Max King
-
 'Governments are launching an assault on the independence of central banks'
Opinion Say goodbye to the era of central bank orthodoxy and hello to the new era of central bank dependency, says Jeremy McKeown
-
 Why investors can no longer trust traditional statistical indicators
Opinion The statistical indicators and data investors have relied on for decades are no longer fit for purpose. It's time to move on, says Helen Thomas
-
 Live: Bank of England holds UK interest rates at 4.5%
The Bank of England voted to hold UK interest rates at their current level of 4.5% in March, as widely anticipated, after inflation rose to 3% in January


