The gold price remains in whipsaw mode
The gold market has been volatile of late, says John C Burford. And while that can be tricky to trade, it also presents opportunities for profits.
Get the latest financial news, insights and expert analysis from our award-winning MoneyWeek team, to help you understand what really matters when it comes to your finances.
You are now subscribed
Your newsletter sign-up was successful
Want to add more newsletters?

Twice daily
MoneyWeek
Get the latest financial news, insights and expert analysis from our award-winning MoneyWeek team, to help you understand what really matters when it comes to your finances.

Four times a week
Look After My Bills
Sign up to our free money-saving newsletter, filled with the latest news and expert advice to help you find the best tips and deals for managing your bills. Start saving today!
Today, I thought I would update the gold story, because it is showing further signs of whipsaw action and remains very tricky to swing trade.
But I believe the picture is getting a little less cloudy, and that's what I hope to show you today.
In my 28 July post, I wrote that fourth waves can be very difficult to trade. It is so easy to be whipsawed to death as the waves get smaller and smaller. We have been in a large fourth wave up since making the infamous wave 3 $1,180 low just over a year ago.
MoneyWeek
Subscribe to MoneyWeek today and get your first six magazine issues absolutely FREE

Sign up to Money Morning
Don't miss the latest investment and personal finances news, market analysis, plus money-saving tips with our free twice-daily newsletter
Don't miss the latest investment and personal finances news, market analysis, plus money-saving tips with our free twice-daily newsletter
Even so, I have managed to take significant profits from the market in the past year all while the market is trading at the same level it achieved last summer.
While a buy-and-hold investor has made no profit in a year, my swing trades have generated good gains. This is the reason I like to swing trade!
The key to making a profitable swing trade
The gold market is rife with people holding firm views where prices are heading. The fundamentalists love to trot out data to support their pre-formed views. Many are very passionate about gold the metal seems to hold a particularly sensitive spot in people's emotional make-up.
The gold market is the most emotional market on the board and I maintain that trader sentiment is the dominant factor driving prices. That applies to all markets, of course. But it applies in spades to gold.
In swing trading, we are trying to find the weakness in the lines of support/resistance and then flow along the path of least resistance until it runs out. We want to be bullish when markets start to rise and bearish when markets start to fall.
I realise this attitude can be difficult to adopt if you have come from a stock investing background where you make a rational analysis of the company's financials and the general economy. When you have decided it is a good investment, you buy and that is often the time when many others have done the same, and the stock then falls back.
When trading with leverage, you cannot afford to make poorly timed trades such as these!
Here's what happened to my gold trade

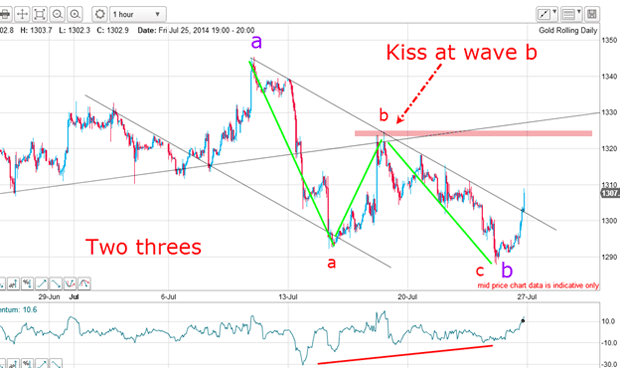
I noted the three-wave patterns (and large positive-momentum divergence) and a sensible trade was to go long on the upper tramline break. A protective stop could then be placed just inside the trading channel for a low-risk trade. A possible first target was the red wave b high at the pink bar.
Let's see how that trade worked out:

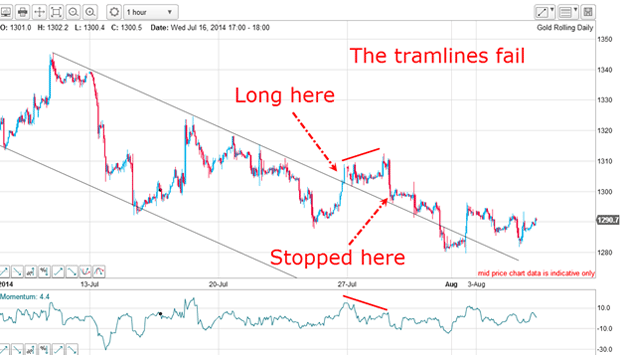
The trade went well to start with, but then ran into trouble with the large negative-momentum divergence as a big warning sign that unless the rally could get its skates on, a decline back to the tramline was likely.
And that is where a kiss was made, but we did not get a scalded-cat bounce. The market dribbled on down along the upper tramline and the trade was stopped out for a small loss. My tramlines had failed and that was a whipsaw loss.
When the market could not escape with a vigorous rally, I knew it was time to abandon those tramlines and begin looking for another set. You see, when the market does not perform as you expect (after giving it a reasonable time to perform), it is best to stand aside and just monitor the action.
Can I find new tramlines?

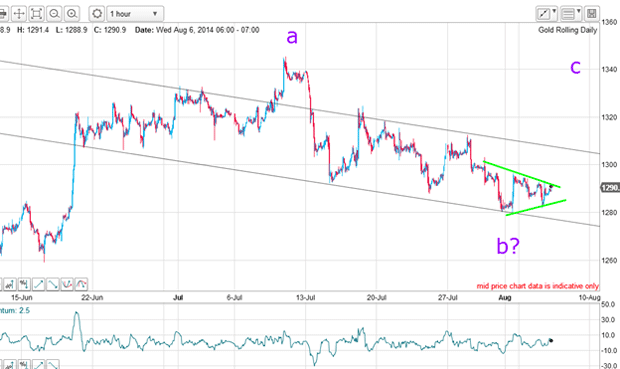
These are my longer-term tramlines where the lower line has three accurate and well-spaced touch points. The 31 July low met support on that line and has bounced up smartly off it. My upper line is less secure, but is the best fit.
With the new low of 31 July, is this my new b wave low? If so, we should see a move above the green triangle towards the upper tramline. The market is currently testing that upper triangle line.
What will happen next?
| (Contracts of 100 troy ounces) | Row 0 - Cell 1 | Row 0 - Cell 2 | Row 0 - Cell 3 | Open interest: 374,467 | ||||
| Commitments | ||||||||
| 188,980 | 49,827 | 21,619 | 126,297 | 275,229 | 336,896 | 346,675 | 37,571 | 27,792 |
| Changes from 07/22/14 (Change in open interest: -31,150) | ||||||||
| -8,855 | -1,862 | -9,867 | -8,512 | -19,771 | -27,234 | -31,500 | -3,916 | 350 |
| Percent of open in terest for each category of traders | ||||||||
| 50.5 | 13.3 | 5.8 | 33.7 | 73.5 | 90.0 | 92.6 | 10.0 | 7.4 |
| Number of traders in each category (Total traders: 260) | ||||||||
| 125 | 67 | 64 | 46 | 54 | 202 | 157 | Row 8 - Cell 7 | Row 8 - Cell 8 |
Up to 29 July, the speculators reduced their long positions somewhat as they reacted to the decline to the lower tramline. But I am unable to glean much of use here.
With the market zigging and zagging, it would not surprise me to see a continuation with no clear direction, although a sharp move up out of the triangle could herald a move to my upper tramline. Then, gold would definitely get very interesting.
Get the latest financial news, insights and expert analysis from our award-winning MoneyWeek team, to help you understand what really matters when it comes to your finances.
John is is a British-born lapsed PhD physicist, who previously worked for Nasa on the Mars exploration team. He is a former commodity trading advisor with the US Commodities Futures Trading Commission, and worked in a boutique futures house in California in the 1980s.
He was a partner in one of the first futures newsletter advisory services, based in Washington DC, specialising in pork bellies and currencies. John is primarily a chart-reading trader, having cut his trading teeth in the days before PCs.
As well as his work in the financial world, he has launched, run and sold several 'real' businesses producing 'real' products.
-
 ISA fund and trust picks for every type of investor – which could work for you?
Whether you’re an ISA investor seeking reliable returns, looking to add a bit more risk to your portfolio or are new to investing, MoneyWeek asked the experts for funds and investment trusts you could consider in 2026
-
 The most popular fund sectors of 2025 as investor outflows continue
It was another difficult year for fund inflows but there are signs that investors are returning to the financial markets