Gold – the ultimate whipsaw market
Swing traders should spend some time getting to know Elliott wave theory, says John C Burford. It offers you a roadmap through volatile markets.
Get the latest financial news, insights and expert analysis from our award-winning MoneyWeek team, to help you understand what really matters when it comes to your finances.
You are now subscribed
Your newsletter sign-up was successful
Want to add more newsletters?

Twice daily
MoneyWeek
Get the latest financial news, insights and expert analysis from our award-winning MoneyWeek team, to help you understand what really matters when it comes to your finances.

Four times a week
Look After My Bills
Sign up to our free money-saving newsletter, filled with the latest news and expert advice to help you find the best tips and deals for managing your bills. Start saving today!
The gold market seems to be bamboozling almost everyone at present. As soon as the market starts to head lower, good buying emerges and turns the market back up. This kind of action is a fertile breeding ground for whipsaw trading unless you have a clear roadmap.
And that is what the Elliott wave theory can offer. I realise that many traders are put off studying this method by its seeming arbitrariness and complexity. That's just what I thought when I first encountered it.
But I recognised that there was something very valuable in the method and I had better try and learn how to use it. It is now one of the three pillars in my tramline trading method. And because I use only the most basic of Elliott-wave concepts, I believe the insights provided can significantly boost your trading performance.
MoneyWeek
Subscribe to MoneyWeek today and get your first six magazine issues absolutely FREE

Sign up to Money Morning
Don't miss the latest investment and personal finances news, market analysis, plus money-saving tips with our free twice-daily newsletter
Don't miss the latest investment and personal finances news, market analysis, plus money-saving tips with our free twice-daily newsletter
To show how Elliott wave theory can help keep you on the right side of the market and avoid being whipsawed the recent action in gold is an object-lesson.
The curious case of the gold trendline

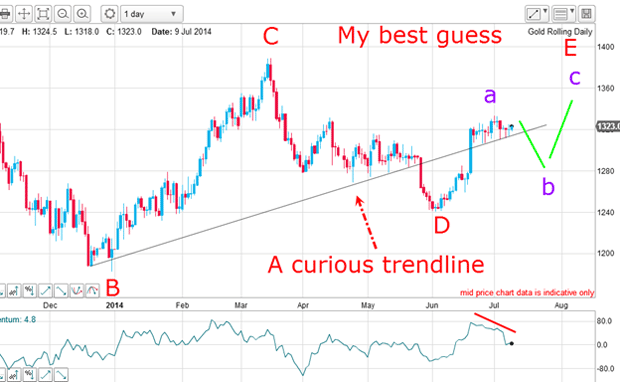
The market was then trading in the $1,320 area and testing the support provided by my curious trendline. Remember, I labelled it curious, because that's just what it is: it starts at the B wave low and accurately touches the spike lows just before and after the D wave low. But that D wave punched through the line by a wide margin. That was a curious development.
Traditionally, the line should then have become resistance and any rally to it would normally end in a kiss and a scalded-cat bounce (I have covered this phenomenon in recent posts).
But the market just ignored the resistance and ploughed right up through the line as if it didn't exist. I wondered if the line had lost its significance as line of support/resistance.
What the little red line tells us
One reason was the little red line on the momentum chart it was showing a clear negative divergence. This usually precedes a reversal.
The other reason was that the a wave had not rallied to the line joining the A and C wave highs. This is a typical ending point for an E wave.
So which scenario is playing out?

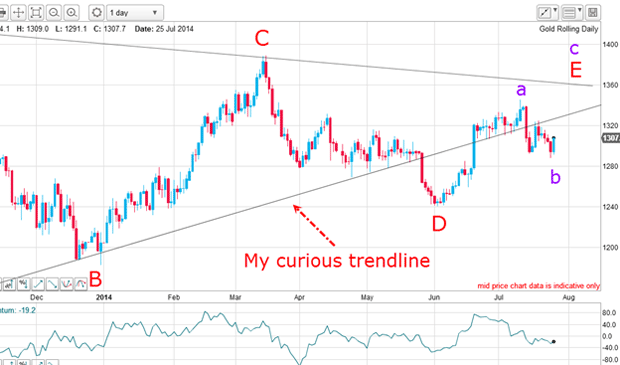
The upper line is the A-C line and since my 16 July post, the market did break the curious trendline support. But then, it rallied to the line again and planted a kiss and then ran down in a scalded-cat bounce. It found support and staged a big rally on Friday. This has created the a-b-c scenario.
And that action has confirmed my forecast so far. From the a wave high in early July, we have a b wave and now appear to be in the c wave up.
Where will the market go from here?
Note that using my roadmap would have kept you out of whipsaw trades. The upside reversal late last week was a surprise to many.
As for the latest COT (commitments of traders) data:
| (Contracts of 100 troy ounces) | Row 0 - Cell 1 | Row 0 - Cell 2 | Row 0 - Cell 3 | Open interest: 405,617 | ||||
| Commitments | ||||||||
| 197,835 | 51,689 | 31,486 | 134,809 | 295,000 | 364,130 | 378,175 | 41,487 | 27,442 |
| Changes from 07/15/14 (Change in open interest: -2,751) | ||||||||
| -2,115 | -5,803 | 2,924 | -3,733 | -448 | -2,924 | -3,327 | 173 | 576 |
| Percent of open in terest for each category of traders | ||||||||
| 48.8 | 12.7 | 7.8 | 33.2 | 72.7 | 89.8 | 93.2 | 10.2 | 6.8 |
| Number of traders in each category (Total traders: 267) | ||||||||
| 124 | 72 | 72 | 46 | 52 | 212 | 161 | Row 8 - Cell 7 | Row 8 - Cell 8 |
It shows not much change as of 22 July before Friday's surge. The hedgies (non-commercials) remain almost four-to-one bullish.
Let's see how recent action looks in close-up on the hourly:

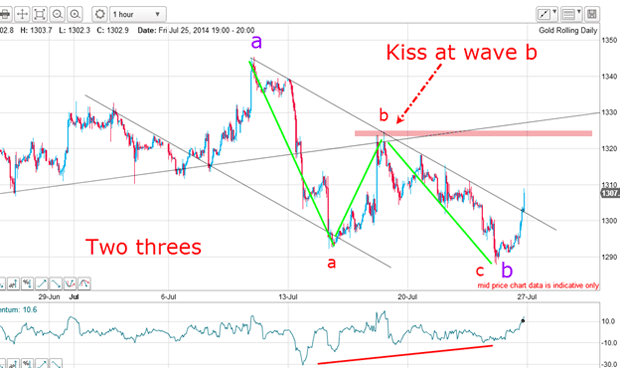
The purple b wave has a clear a-b-c structure (corrective) and I have an excellent tramline pair working. In particular, the upper line has multiple accurate touch points and on Friday, the market punched up through it. This is a significant bullish development.
The other supportive factor is the large positive-momentum divergence at the purple b wave low (a warning sign on Friday to expect a reversal!).
The market is following my roadmap
To sum up: the market is following my road map so far. It calls for a new high at or near the A-C line in the $1,360 area. The market should encounter chart resistance here and a fall-back to the upper trendline appears likely. A kiss there and a scalded-cat bounce up would confirm my c wave scenario.
Get the latest financial news, insights and expert analysis from our award-winning MoneyWeek team, to help you understand what really matters when it comes to your finances.
John is is a British-born lapsed PhD physicist, who previously worked for Nasa on the Mars exploration team. He is a former commodity trading advisor with the US Commodities Futures Trading Commission, and worked in a boutique futures house in California in the 1980s.
He was a partner in one of the first futures newsletter advisory services, based in Washington DC, specialising in pork bellies and currencies. John is primarily a chart-reading trader, having cut his trading teeth in the days before PCs.
As well as his work in the financial world, he has launched, run and sold several 'real' businesses producing 'real' products.
-
 UK interest rates live: rates held at 3.75%
The Bank of England’s Monetary Policy Committee (MPC) met today to decide UK interest rates, and voted to hold rates at their current level
-
 MoneyWeek Talks: The funds to choose in 2026
Podcast Fidelity's Tom Stevenson reveals his top three funds for 2026 for your ISA or self-invested personal pension