The gold market sell-off has begun
A sell-off in gold is underway. But ignore the news hype, says John C Burford. Only the charts can tell you why.
Get the latest financial news, insights and expert analysis from our award-winning MoneyWeek team, to help you understand what really matters when it comes to your finances.
You are now subscribed
Your newsletter sign-up was successful
Want to add more newsletters?

Twice daily
MoneyWeek
Get the latest financial news, insights and expert analysis from our award-winning MoneyWeek team, to help you understand what really matters when it comes to your finances.

Four times a week
Look After My Bills
Sign up to our free money-saving newsletter, filled with the latest news and expert advice to help you find the best tips and deals for managing your bills. Start saving today!
Today, I want to show how gold is following my roadmap and how the simple Elliott wave and Fibonacci ideas I use can pinpoint highly accurate targets.
On Friday, gold was trading at the $1,340 level. Then on Monday, it suffered a heavy collapse and traded over $30 lower on the day, and fell further yesterday.
So what shock news item emerged to produce this massive sell-off?
MoneyWeek
Subscribe to MoneyWeek today and get your first six magazine issues absolutely FREE

Sign up to Money Morning
Don't miss the latest investment and personal finances news, market analysis, plus money-saving tips with our free twice-daily newsletter
Don't miss the latest investment and personal finances news, market analysis, plus money-saving tips with our free twice-daily newsletter
Of course, there wasn't one. There was no sudden outbreak of world peace, no massive dumping of the metal onto the market, or a huge devaluation in the dollar. That is the traditional way of thinking of most pundits.
They want to believe a story' that rationalises market action. And despite plenty of evidence that news does not drive markets (I have outlined plenty in my posts), this error is still being clung to.
Why? Simply because it pays for them to spin a story that most people can follow and understand.
But that's OK with me! It means that the same universal forces are at work to produce those sentiment extremes I rely on to forecast market tops and bottoms.
If traders suddenly realised the error of their ways, I would be in big trouble.
But I am confident that will never happen in my lifetime or anyone's. Most traders believe they can figure out the market from what's called the fundamentals (economic data, mine production, jewellery demand from China, and so on).
I don't even try to understand these fundamentals, because I don't need to. Give me a chart and sentiment data and that's about all I need.
My gold forecasts, derived purely from chart action and sentiment, have been pretty accurate so far this year. How have the fundamentalists' forecasts fared?
Here's what happened on Monday
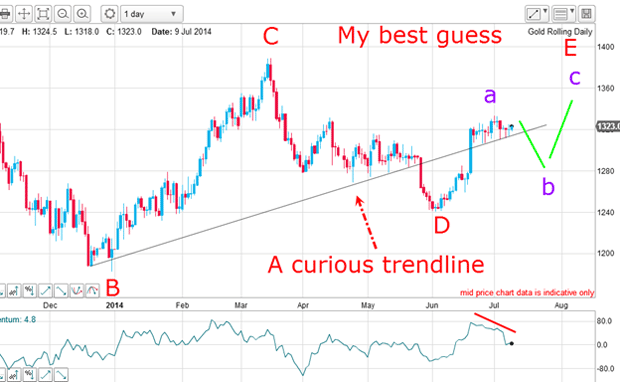
This is a close-up of my road map that I showed on Wednesday:

I labelled the recent rally as an a wave within the larger E wave, and expected a decline in a b wave. This is what I wrote:
"But I have one problem with this budding E wave it has been straight up. Note that all of the other letter waves have a structure. A wave is a five up, B wave is a three down, C wave is five up, and the D wave is three down. I would expect the E wave to be either a three or a five."
I reasoned that if my curious trendline could be broken, that would force the market sharply lower, since there would likely be a mass of sell-stops placed there by the bulls. It was an obvious place to set stops. And many of these bulls were late-comers to the party as revealed by the latest commitments of traders (COT) data:
| (Contracts of 100 troy ounces) | Row 0 - Cell 1 | Row 0 - Cell 2 | Row 0 - Cell 3 | Open interest: 410,992 | ||||
| Commitments | ||||||||
| 203,464 | 53,443 | 27,240 | 135,998 | 302,001 | 366,702 | 382,684 | 44,290 | 28,308 |
| Changes from 07/01/14 (Change in open interest: 9,179) | ||||||||
| 2,177 | -1,819 | 5,249 | 554 | 6,102 | 7,980 | 9,532 | 1,199 | -353 |
| Percent of open in terest for each category of traders | ||||||||
| 49.5 | 13.0 | 6.6 | 33.1 | 73.5 | 89.2 | 93.1 | 10.8 | 6.9 |
| Number of traders in each category (Total traders: 277) | ||||||||
| 132 | 67 | 68 | 52 | 57 | 216 | 166 | Row 8 - Cell 7 | Row 8 - Cell 8 |
The rise in the number of bullish speculators in recent weeks has been marked. As of 8 July, there were now four times as many bulls as bears within the hedge fund sector (non-commercials).
As I wrote on Wednesday: "Have they overstretched themselves again?"
We all know what happens when the market sniffs out a mass of stops it guns for them. In market parlance, the market runs the stops - and that is exactly what occurred on Monday. There was no external news item to provoke the selling. There was simply a dearth of buyers at the $1,340 level and the touch paper was lit.
But crucially, it did confirm my forecast for a b wave dip.
The moment of truth

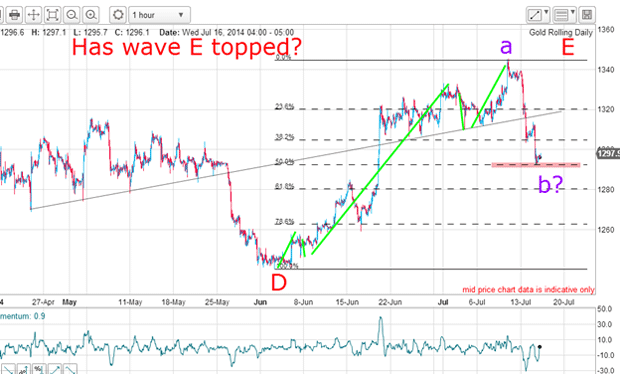
This week's decline certainly qualifies as a b wave, having made a clear break of my trendline. Note that it stopped falling yesterday on the precise Fibonacci 50% level a remarkable confirmation of the forecasting abilities of Fibonacci.
And the 50% level is one of the most common places for a turn. The other common turning point is the 62% level, and the market could decline to this level without invalidating my scenario.
But now we are at the moment of truth.
There are two alternatives: the first is for the market to make a base here (or nearby) and then rally up in wave c to carry above the a wave high, making the final E wave top. The second is for the market to continue lower, having already put in the E wave top at the a wave high.
The second option is on the table, because the form of the a wave is in a clear five motive waves (marked by green lines). And the third wave also contains a clear five sub-wave pattern. This implies that the a wave is complete and we are in the final large fifth wave down.
Which way will the market go?

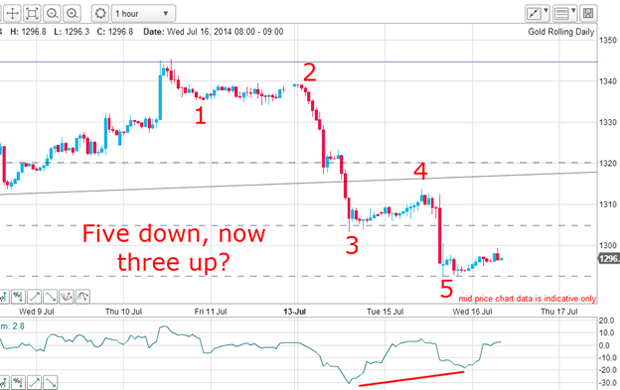
This is a textbook five-wave motive pattern, complete with a positive-momentum divergence at the wave 5 low. And admire the precise hit on the 50% Fibonacci level.
With a five down, the normal outcome is a three up, but after that, one of the two options should kick in.
But under either scenario, my best guess is turning out to be highly accurate, so far.
Get the latest financial news, insights and expert analysis from our award-winning MoneyWeek team, to help you understand what really matters when it comes to your finances.
John is is a British-born lapsed PhD physicist, who previously worked for Nasa on the Mars exploration team. He is a former commodity trading advisor with the US Commodities Futures Trading Commission, and worked in a boutique futures house in California in the 1980s.
He was a partner in one of the first futures newsletter advisory services, based in Washington DC, specialising in pork bellies and currencies. John is primarily a chart-reading trader, having cut his trading teeth in the days before PCs.
As well as his work in the financial world, he has launched, run and sold several 'real' businesses producing 'real' products.
-
 ISA fund and trust picks for every type of investor – which could work for you?
Whether you’re an ISA investor seeking reliable returns, looking to add a bit more risk to your portfolio or are new to investing, MoneyWeek asked the experts for funds and investment trusts you could consider in 2026
-
 The most popular fund sectors of 2025 as investor outflows continue
It was another difficult year for fund inflows but there are signs that investors are returning to the financial markets