Where is the gold price heading to now?
Gold has been following the script almost to the letter. John C Burford looks at where the market is heading to next.
Get the latest financial news, insights and expert analysis from our award-winning MoneyWeek team, to help you understand what really matters when it comes to your finances.
You are now subscribed
Your newsletter sign-up was successful
Want to add more newsletters?

Twice daily
MoneyWeek
Get the latest financial news, insights and expert analysis from our award-winning MoneyWeek team, to help you understand what really matters when it comes to your finances.

Four times a week
Look After My Bills
Sign up to our free money-saving newsletter, filled with the latest news and expert advice to help you find the best tips and deals for managing your bills. Start saving today!
Today, I thought I would follow up on the gold story, which has been fascinating this year and has been following my script almost perfectly, so far.
In my Gold Report, which I wrote in early May, I made a forecast for gold prices over the next three months. But bear in mind that all of my forecasts are subject to change in light of new evidence primarily provided by sentiment changes. These are revealed in the COT (commitments of traders) data and the DSI (Daily Sentiment Index).
So let's see what gold has been doing since May.
MoneyWeek
Subscribe to MoneyWeek today and get your first six magazine issues absolutely FREE

Sign up to Money Morning
Don't miss the latest investment and personal finances news, market analysis, plus money-saving tips with our free twice-daily newsletter
Don't miss the latest investment and personal finances news, market analysis, plus money-saving tips with our free twice-daily newsletter
Watch out for the whipsaw
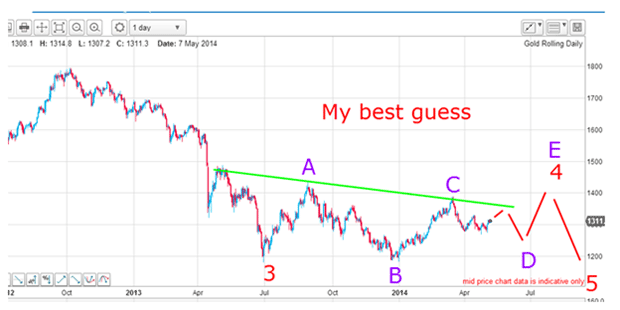
This was my best guess' that I made in early May:

I figured that the market was in a complex wave 4 up, which was likely to consist of several large up and down waves. Ideally, I would like to see five clear lettered waves before the market moves down in a final wave 5.
I have found that complex large-scale fourth waves are common and are minefields for the unwary. Just when you see a trend develop, it reverses and you get stopped out. And when that new trend is apparent, it reverses and stops you out yet again in a classic whipsaw.
Whipsaws are the bane of all traders. It is easy to become frustrated with your trading and that is when you need to resolve to maintain discipline. Taking a breather is fine and is usually the best policy. You can then clear your mind and start afresh. Having a balanced mind is crucial for trading.
The best and safest way to play these waves (if you choose to) is to enter your trades as close to the turn points as possible.
The charts tell the real gold story
In my Gold Report, I projected the D wave low sometime in June, then a rally into July, which could be the final E wave (and wave 4 high). But I had an alternative that would allow for a high in early July, then a small dip and then a further rally into late July/August for the E wave and wave 4 high.
Naturally, I would be looking for those latter highs as an opportunity to short, expecting the final wave 5 down to begin. That would be a wave to ride!
So how is my forecast working out? Note that many gold bulls have been calling recently for a resumption of the rally from $1,300 to a new high above $2,000 in the next few months/years. Bullish sentiment has zoomed up in recent weeks.
They are basing that forecast on a mix of wishful thinking (a very common method of analysis in pundit-land), a belief that inflation is finally around the corner, global instability, a soon-to-top stock market, booming demand from China the list is almost endless. There is no shortage of great gold stories.
I prefer to let the charts tell me their story, and draw conclusions from them.
What the charts are telling us
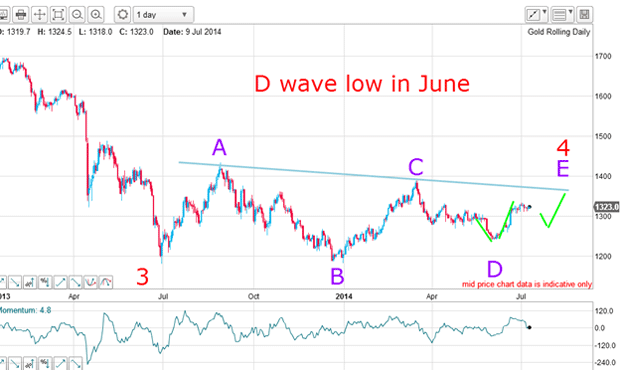
Here is the updated daily gold chart:

My D wave was completed in June and we have the rally in wave E. So far, so good.
But I have one problem with this budding E wave it has been straight up. Note that all of the other letter waves have a structure. A wave is a five up, B wave is a three down, C wave is five up, and the D wave is three down. I would expect the E wave to be either a three or a five.
The simplest pattern would be a three. For this reason, I expect a dip from near current levels and then a rally to complete the E wave (and wave 4).
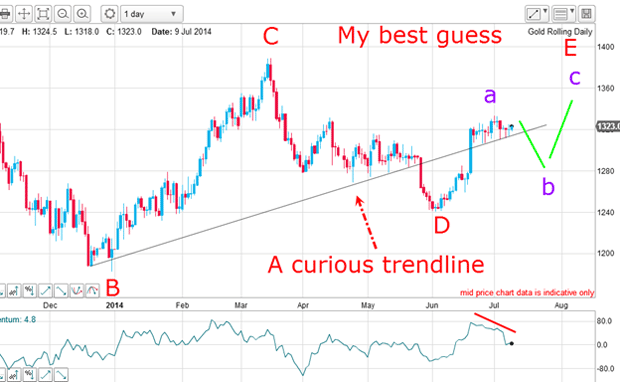
Let's look at a close-up:

I have drawn in a most curious trendline which runs from December and which connects the multiple low pigtail extremes from April. The accuracy of the touch points is striking.
Today, this line represents strong support, but if the market declines in my suggested b wave, it will be broken and the decline should be sharp (as it was in late June). But the next move should be a new rally in my c wave to complete a three-wave pattern for the E wave.
There is a looming negative-momentum divergence currently, which points to an upcoming dip of some sort.
Are the hedgies overstretched?
Of course, the market may decide to resume its uptrend off the trendline support, but the odds are somewhat lower. One reason is the very large bullish swing by the speculators, as revealed by the COT data:
| (Contracts of 100 Troy ounces) | Row 0 - Cell 1 | Row 0 - Cell 2 | Row 0 - Cell 3 | Open interest: 401,813 | ||||
| Commitments | ||||||||
| 201,287 | 55,262 | 21,991 | 135,444 | 295,899 | 358,722 | 373,152 | 43,091 | 28,661 |
| Changes from 06/24/14 (Change in open interest: 9,425) | ||||||||
| 17,854 | -7,312 | -2,968 | -7,420 | 21,428 | 7,466 | 11,148 | 1,959 | -1,723 |
| Percent of open in terest for each category of traders | ||||||||
| 50.1 | 13.8 | 5.5 | 33.7 | 73.6 | 89.3 | 92.9 | 10.7 | 7.1 |
| Number of traders in each category (Total traders: 279) | ||||||||
| 133 | 69 | 60 | 53 | 54 | 214 | 159 | Row 8 - Cell 7 | Row 8 - Cell 8 |
With that swing, the hedgies (non-commercials) are now almost four-to-one bullish a remarkable Damascene conversion from the situation only a few weeks ago when they were net bearish.
Have they overstretched themselves again?
Get the latest financial news, insights and expert analysis from our award-winning MoneyWeek team, to help you understand what really matters when it comes to your finances.
John is is a British-born lapsed PhD physicist, who previously worked for Nasa on the Mars exploration team. He is a former commodity trading advisor with the US Commodities Futures Trading Commission, and worked in a boutique futures house in California in the 1980s.
He was a partner in one of the first futures newsletter advisory services, based in Washington DC, specialising in pork bellies and currencies. John is primarily a chart-reading trader, having cut his trading teeth in the days before PCs.
As well as his work in the financial world, he has launched, run and sold several 'real' businesses producing 'real' products.
-
 ISA fund and trust picks for every type of investor – which could work for you?
Whether you’re an ISA investor seeking reliable returns, looking to add a bit more risk to your portfolio or are new to investing, MoneyWeek asked the experts for funds and investment trusts you could consider in 2026
-
 The most popular fund sectors of 2025 as investor outflows continue
It was another difficult year for fund inflows but there are signs that investors are returning to the financial markets