US markets are at all-time highs - are stocks in a bubble?
Investors don't seem to be heeding the warnings that US stocks are in a bubble, says John C Burford. This won't end well.
Get the latest financial news, insights and expert analysis from our award-winning MoneyWeek team, to help you understand what really matters when it comes to your finances.
You are now subscribed
Your newsletter sign-up was successful
Want to add more newsletters?

Twice daily
MoneyWeek
Get the latest financial news, insights and expert analysis from our award-winning MoneyWeek team, to help you understand what really matters when it comes to your finances.

Four times a week
Look After My Bills
Sign up to our free money-saving newsletter, filled with the latest news and expert advice to help you find the best tips and deals for managing your bills. Start saving today!
With US stock markets at or near their all-time highs (with the glaring exception of the tech-heavy Nasdaq), there is much debate over whether stocks and assets in general are in bubble territory.
In fact, if you google the phrase "financial bubble", you find 148 million hits. I am not sure whether this is at or near a record, but the bubble worry permeates much commentary today.
The word bubble is so emotive! My first reaction is uh-oh, here comes a collapse in values. I'm sure most people have the same gut reaction.
MoneyWeek
Subscribe to MoneyWeek today and get your first six magazine issues absolutely FREE

Sign up to Money Morning
Don't miss the latest investment and personal finances news, market analysis, plus money-saving tips with our free twice-daily newsletter
Don't miss the latest investment and personal finances news, market analysis, plus money-saving tips with our free twice-daily newsletter
But does this wall of bubble worry mean that stocks will continue to climb? After all, that's what stock markets do, isn't it? Surely, the fact that just about every man and his dog has seen numerous bubble warnings recently and the market has held up nonetheless means the market is discounting the bubble fears?
We've seen this before and it never ends well
This suggests that it is not necessary for a major top in stock markets to be made with a low bubble awareness factor. This seems at first to be counter-intuitive to me. In terms of sentiment, it is true that all major tops are made when bullishness is extreme.
Surely, a person in a bullish mood would resist the idea that stocks are in bubble territory they would dismiss the very notion, and find rationalisations to justify their belief.
And that is the answer to our conundrum: the bulls are ignoring the evidence proposed by the bears who often put forward a solid case for why stocks are in a bubble (or at least, wildly overvalued and over-leveraged).
I have read many articles recently where the author admits that there is probably a bubble, but stocks will keep rising anyway (rising company earnings, low interest rates, poor returns elsewhere). To me, this is a sign that the complacent bulls are in denial. This is what happens when people join a herd, especially late in the game.
Why denial? Just as retail investors are now finally comfortable with making stock investments (after five years of rising markets) especially of the riskier variety - there is a subtle gradual shift in underlying sentiment from complacently bullish to a more cautious stance going on under the surface.
The bull market's ailing health
One of them is the Russell 2,000 Index, which is a small-cap index of the smallest 2,000 stocks in the Russell 3,000 index. It is the most common benchmark for small-cap mutual funds. It has only around 8% of the market cap of the larger index and can be considered a high-risk index.
The Russell 1,000 index is a large-cap index of the largest 1,000 stocks in the 3,000 Index and represents over 90% of the capitalisation of the 3,000 Index. It can be considered a lower-risk index. It contains such household names as General Electric, Bank of America, Apple, IBM, and so on.
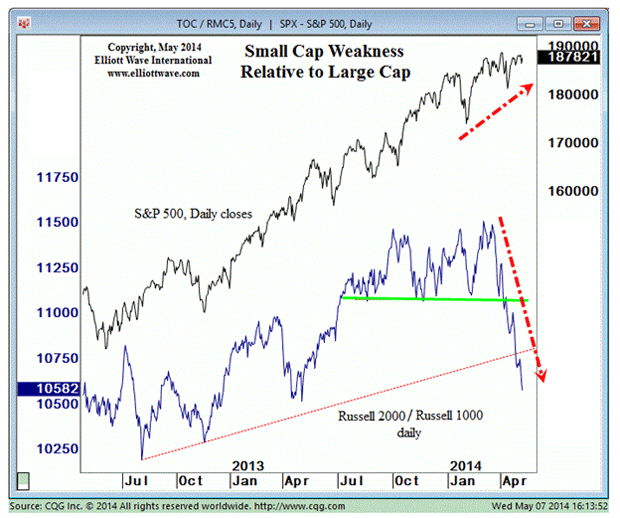
In a healthy bull market, the Russell 2,000 and 1,000 indexes should move up more or less together. But recently, the two indexes have started to diverge wildly and sent out a massive warning sign that all is not well with the bull market's health.
Here is a chart of the ratio of the two indexes:

Chart courtesy elliottwave.com
The high-risk/low-risk ratio rose along with the S&P 500 index in a healthy manner until March when the ratio topped out and fell off a cliff. Meanwhile, the S&P continues its uptrend.
The steepness of the decline and the break of the shelf of support (green line) is telling me that there is now a flight from risk in stocks. And the severe underperformance of another high-risk index, the Nasdaq, is another warning sign.
There are plenty of signs that markets are heading down

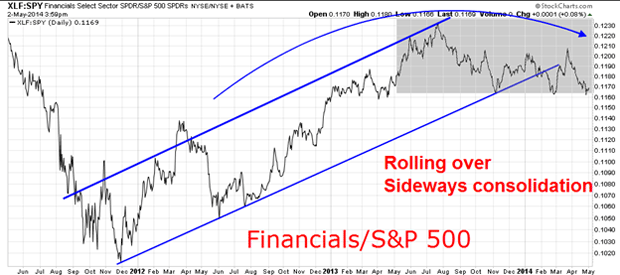
The ratio topped last July (at precisely the same time as the $1,180 bottom was made in gold, please note). It has been in a large consolidation zone since then, and is currently in danger of breaking below this zone.
Remember, the financials have been leaders on the way up (thanks to quantitative easing, of course) and if history is any guide, it will be one of the leaders on the way down.
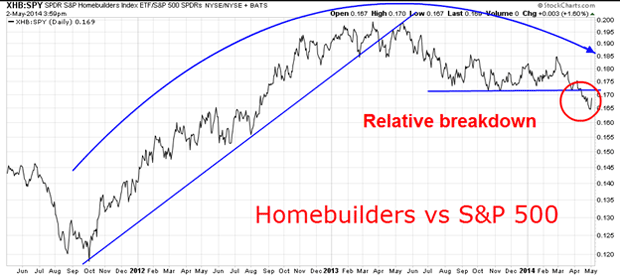
Another canary in the mine is the relative performance of the house-builders. Housing is central to the US economy, and the sub-prime mortgage fiasco within the housing industry was a leading light of the credit crunch of 2007 2009. It, too, will be a leading sector on the way down.

Note that the ratio topped in May last year at the same time as the May Dow high, which led to a 1,000 point decline. Note the break of the uptrend line last April and the subsequent kiss on the underside of the line, and then a steady decline in a scalded-cat bounce. This is classic change-of-trend behaviour.
The ratio has now broken out of the consolidation zone and appears headed lower with full bearish implications for not only the US economy, but stock markets in general. These charts tell us that all is not well.
What the steady Eddie' of the equity world tells us
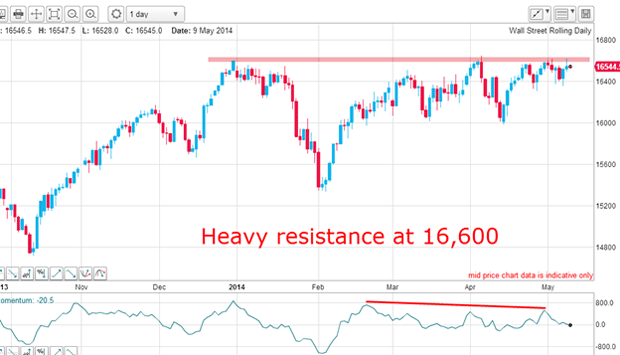
Let's take a look at the current daily Dow chart:

The closing high of 16,600 on 31 December has not been exceeded, despite excited media claims of new all-time highs. The resistance is holding so far and it would take a solid daily close above 16,600 to convince me that the rally is not running out of steam.
There is an ominous negative-momentum divergence working (red bar), and yesterday's assault on this level was firmly rejected.
Does the market have enough strength to power through this critical level? I have a feeling we shall soon find out.
Get the latest financial news, insights and expert analysis from our award-winning MoneyWeek team, to help you understand what really matters when it comes to your finances.
John is is a British-born lapsed PhD physicist, who previously worked for Nasa on the Mars exploration team. He is a former commodity trading advisor with the US Commodities Futures Trading Commission, and worked in a boutique futures house in California in the 1980s.
He was a partner in one of the first futures newsletter advisory services, based in Washington DC, specialising in pork bellies and currencies. John is primarily a chart-reading trader, having cut his trading teeth in the days before PCs.
As well as his work in the financial world, he has launched, run and sold several 'real' businesses producing 'real' products.
-
 Average UK house price reaches £300,000 for first time, Halifax says
While the average house price has topped £300k, regional disparities still remain, Halifax finds.
-
 Barings Emerging Europe trust bounces back from Russia woes
Barings Emerging Europe trust has added the Middle East and Africa to its mandate, delivering a strong recovery, says Max King