
It’s Monday, which means it’s technical analysis day. We are going to look at an indicator that was introduced in the early 1980s – the commodity channel index, henceforward called CCI.
Despite its name, the indicator is used to measure stocks and currencies as well as commodities. Its purpose is to determine whether something is overbought or oversold. To use the jargon, it’s a “momentum-based oscillator”. It will help you decide if you want to enter a trade, exit one, refrain from taking one, or even add to a position.
The reason I mention it today is that it is pertinent to conditions in the price of everyone’s favourite unreliable metal, silver.
Try 6 free issues of MoneyWeek today
Get unparalleled financial insight, analysis and expert opinion you can profit from.

Sign up to Money Morning
Don't miss the latest investment and personal finances news, market analysis, plus money-saving tips with our free twice-daily newsletter
Don't miss the latest investment and personal finances news, market analysis, plus money-saving tips with our free twice-daily newsletter
Time to sell silver?
This is a monthly chart of silver that goes back to 1980. The CCI is plotted underneath. I have drawn a dashed line at 250 on the CCI. Every time silver has gone to 250 or above – ie, above the dashed line – I have drawn a blue arrow. The point to note is that every time silver has gone above 250 – ie, become very overbought – a correction of at least 25% has followed. This is shown by the shaded box and red arrow.

According to the measure that is CCI, silver, at 340, is the most overbought it has been since 1987.
However, let me qualify that. CCI works by measuring the difference between the current price and the historical average. Because silver has shot up so dramatically since March, the difference between silver in the $28 region is a lot more marked than silver in the $15-$17 region where it has been atrophying these last few years. Thus that CCI reading is so extreme. Nevertheless it is still saying be a seller of silver not a buyer here.
The corrections in silver from overbought levels have been much more violent and long-lasting during secular bear markets. Look at those two corrections in the 1980s. Silver lost over 50% of its value each time, and the falls continued for years.
The corrections in the bull market of the 2000s were shorter and less severe. In 2005, silver went from $8 to $5, but the correction lasted just a few months. In 2006 silver went from $15 to below $10, again the correction lasted just a few months.
In 2008, ouch, it went from $21 to $8, but after maybe nine months of pain, more bull market followed with silver eventually going to $50.
But look at that 2011 reading. It was already overbought with silver at $22. Silver went all the way to $50 before the correction kicked in. So silver can go a lot higher before it corrects. The message there? Let your longs run but use stops. The bear market that followed saw a 75% correction in silver.
There’s a lot of risk, but silver is still frothy
There is a lot of risk in the silver market in the moment. Some of the froth has come off. We came within touching distance of $30 now we are at $26. But it is still frothy.
Meanwhile, the dollar looks like it is stabilising. That is not good for precious metals.
It’s silver. Anything can happen. It’s why I am so ambivalent about it. But the advice of this long-term indicator is: caution. The time to be an aggressive buyer is when CCI slips to -150. That doesn’t always work. In a bear market it usually rallies before sinking further, but in bull markets it will catch you the lows. Either way you minimize risk.
This feels like a correction – a healthy, necessary correction in a bull market to me, but I do note similarities in the price action to 1997. A big dip during the Asian crisis followed by a spike, then drifting down to multi-year lows. So I am keeping an open mind. But for now I stick with my healthy correction theory.
On a shorter-term basis I find CCI less reliable with silver. It’s an indicator to be used in conjunction with others. But we have slipped back to the zero line, which is good. It means a lot of the excess has already been washed out.

On a short-term basis CCI actually works better for the buys than the sells. When we get to -150 that’s usually the time to be looking towards the buy button. We are not there yet. But that longer-term indicator is suggesting we soon will be.

-
 NS&I boosts interest rates on 8 fixed-rate savings accounts – are they any good?
NS&I has made their fixed-rate savings accounts more attractive. Are they the best on the market?
-
 The Rex, Manchester: Art Deco masterpiece with a unique past
The Rex in Manchester is a trendy new luxury hotel and private members' club. It isn't nicknamed The King of King Street for nothing.


-
 What's behind the big shift in Japanese government bonds?
Rising long-term Japanese government bond yields point to growing nervousness about the future – and not just inflation
-
 Why you should keep an eye on the US dollar, the most important price in the world
Advice The US dollar is the most important asset in the world, dictating the prices of vital commodities. Where it goes next will determine the outlook for the global economy says Dominic Frisby.
-
 What is FX trading?
What is FX trading and can you make money from it? We explain how foreign exchange trading works and the risks
-
 The Burberry share price looks like a good bet
Tips The Burberry share price could be on the verge of a major upswing as the firm’s profits return to growth.
-
 Sterling accelerates its recovery after chancellor’s U-turn on taxes
News The pound has recovered after Kwasi Kwarteng U-turned on abolishing the top rate of income tax. Saloni Sardana explains what's going on..
-
 Why you should short this satellite broadband company
Tips With an ill-considered business plan, satellite broadband company AST SpaceMobile is doomed to failure, says Matthew Partridge. Here's how to short the stock.
-
 It’s time to sell this stock
Tips Digital Realty’s data-storage business model is moribund, consumed by the rise of cloud computing. Here's how you could short the shares, says Matthew Partridge.
-
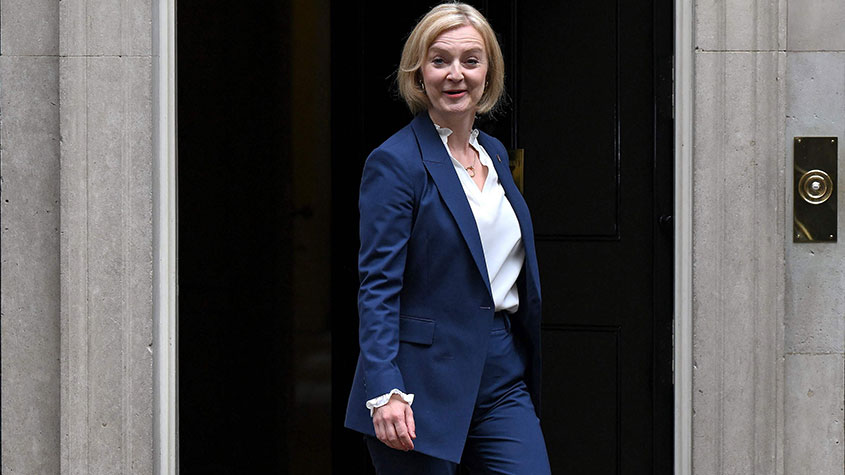 Will Liz Truss as PM mark a turning point for the pound?
Analysis The pound is at its lowest since 1985. But a new government often markets a turning point, says Dominic Frisby. Here, he looks at where sterling might go from here.


