Will stock markets rally in the charts?
Right on cue, the Dow Jones has taken a pasting, says John C Burford. But now the market has reached a very interesting point.
Get the latest financial news, insights and expert analysis from our award-winning MoneyWeek team, to help you understand what really matters when it comes to your finances.
You are now subscribed
Your newsletter sign-up was successful
Want to add more newsletters?

Twice daily
MoneyWeek
Get the latest financial news, insights and expert analysis from our award-winning MoneyWeek team, to help you understand what really matters when it comes to your finances.

Four times a week
Look After My Bills
Sign up to our free money-saving newsletter, filled with the latest news and expert advice to help you find the best tips and deals for managing your bills. Start saving today!
On Friday, I asked the question: Is this the start of a big downward correction in shares? Today, I want to examine this question further in light of last week's action.
This was the chart then:
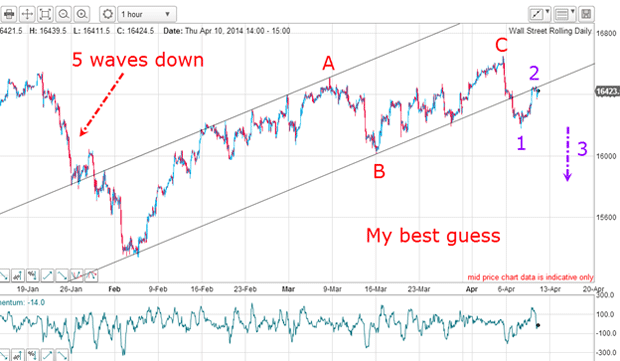
You can see that the Dow was rallying into a kiss on my lower tramline. If the market could finish its kiss and move down off strong resistance in a classic scalded cat bounce, it would validate my theory that stocks were indeed on a downward path following the initial tramline break. Remember, a genuine tramline break signifies that the short-term trend has likely turned.
MoneyWeek
Subscribe to MoneyWeek today and get your first six magazine issues absolutely FREE

Sign up to Money Morning
Don't miss the latest investment and personal finances news, market analysis, plus money-saving tips with our free twice-daily newsletter
Don't miss the latest investment and personal finances news, market analysis, plus money-saving tips with our free twice-daily newsletter
And on Thursday and Friday, stocks were hit hard and my scalded cat bounce materialised on cue.
But this morning, the market has reached a very interesting point: the Dow is at the round-number 16,000 level which previously was a support level.
So today, I want to analyse the chart and see if I can come up with some trading strategies now that I have a short trade working from Thursday.
Could we see a significant rally?
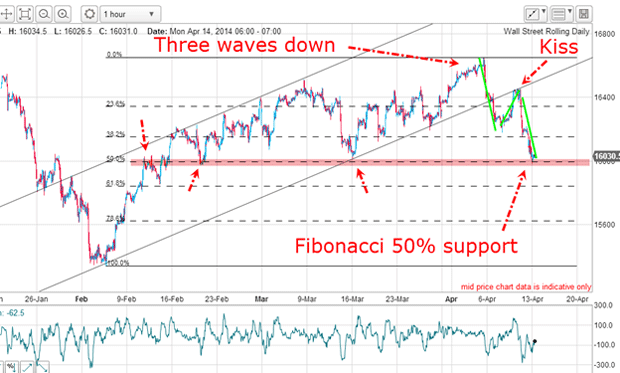
That move late last week provided more evidence that the main trend had changed. But before I can say that with confidence, there are some very high hurdles the market must first overcome.
The market has fallen to the precise Fibonacci 50% retrace a common support level from where a bounce could start.
The 16,000 level has been strong resistance/support before (see red arrows). The market believes this level is significant and the market could stage a large rally from here as it has since mid-February.
The move down is in three waves only. Instead of this being the start of a five-wave pattern (indicating a new down trend), we could have an A-B-C (indicating a correction to the on-going bull trend).
Together, these factors could well support a case for a significant rally from current levels.
This looks like it could be a decent rally
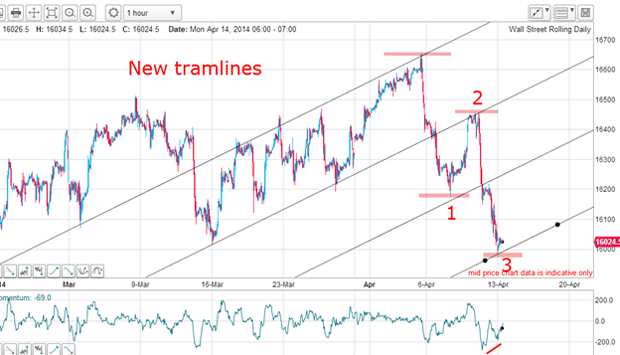
I can now draw in a new tramline set. The second line down is my original lower tramline. The new upper line is very reliable since it contains a lovely PPP (prior pivot point) and runs across the minor highs.
The wave 1 low was stopped right on my third tramline, bounced up for the kiss, and then broke that tramline to hit my fourth tramline, where it is now trading on that support.
But that is not all my waves 1 and 3 are of equal height to within ten pips! In Elliot wave theory, waves A and C of an A-B-C pattern are often equal. This is called the equality rule and is a common relationship in corrective patterns.
In addition, there is a large negative-momentum divergence at today's level, which indicates selling pressure is drying up.
Putting all this together, the case for a third wave has weakened considerably. Rather, the case for a decent rally from current levels has gained strength. Whether this rally turns into a more substantial leg up, or just a small rise before the 16,000 level is broken time will tell.
But with this evidence, the gains on my short trade at the 16,450 level on Thursday appear vulnerable. That is why I decided to use my split bet strategy and take the 400-pip profit on one half of my position.
I have left the other half open and moved my protective stop to break even, following my break-even rule. This is classic use of my split bet strategy.
The downtrend has been stopped for now
The Nasdaq has been leading the charge lower in the flight from risk:
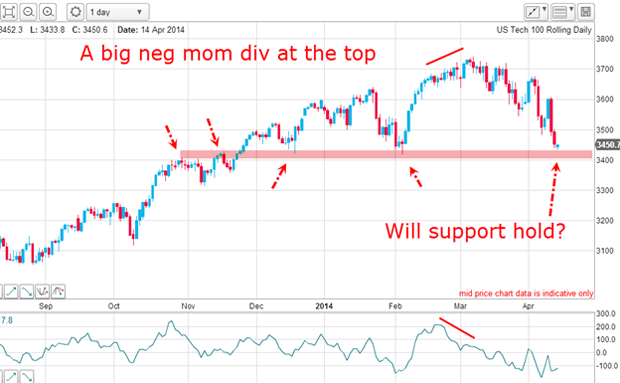
Note the rally into last week's high was accompanied by a very wide negative-momentum divergence, which usually heralds a large correction, which we have seen.
Here too, the Nasdaq has fallen to a major support level.
And here is the FTSE 100 chart:
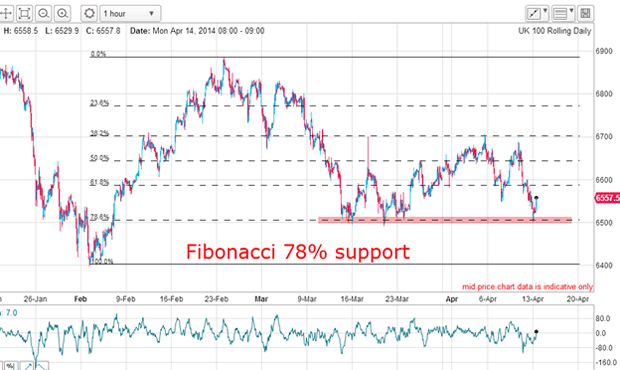
Right on cue, the market is testing the Fibonacci 78% support level again.
In all three markets, prices have hit major support.
This is compelling evidence that the downtrend has very likely been stopped at least for now.
My win-win trading strategy
But with my trading strategy, I have taken a good profit and at worst will suffer no loss on the open trade if the market rallies strongly through my stop.
And if the market does break down, I will be ready to add to my open short position which is already in profit.
This is a win-win strategy and note that it does not rely on my making a definite forecast as to direction. I have a winning (and not losing) strategy for any eventuality the market may throw at me.
Remember, swing trading involves finding the path of least resistance and having the courage to go with it whether it is up or down. Having a pre-determined view is fatal. Stay nimble with an open mind.
Get the latest financial news, insights and expert analysis from our award-winning MoneyWeek team, to help you understand what really matters when it comes to your finances.
John is is a British-born lapsed PhD physicist, who previously worked for Nasa on the Mars exploration team. He is a former commodity trading advisor with the US Commodities Futures Trading Commission, and worked in a boutique futures house in California in the 1980s.
He was a partner in one of the first futures newsletter advisory services, based in Washington DC, specialising in pork bellies and currencies. John is primarily a chart-reading trader, having cut his trading teeth in the days before PCs.
As well as his work in the financial world, he has launched, run and sold several 'real' businesses producing 'real' products.
-
 ISA fund and trust picks for every type of investor – which could work for you?
Whether you’re an ISA investor seeking reliable returns, looking to add a bit more risk to your portfolio or are new to investing, MoneyWeek asked the experts for funds and investment trusts you could consider in 2026
-
 The most popular fund sectors of 2025 as investor outflows continue
It was another difficult year for fund inflows but there are signs that investors are returning to the financial markets