Why the euro could surprise a lot of traders
Everyone and his dog is bearish the euro. But could they be wrong, asks John C Burford? Here, he lists five reasons there could be a bounce in the euro.
Get the latest financial news, insights and expert analysis from our award-winning MoneyWeek team, to help you understand what really matters when it comes to your finances.
You are now subscribed
Your newsletter sign-up was successful
Want to add more newsletters?

Twice daily
MoneyWeek
Get the latest financial news, insights and expert analysis from our award-winning MoneyWeek team, to help you understand what really matters when it comes to your finances.

Four times a week
Look After My Bills
Sign up to our free money-saving newsletter, filled with the latest news and expert advice to help you find the best tips and deals for managing your bills. Start saving today!
TABLE.ben-table TABLE {BORDER-BOTTOM: #2b1083 1px solid; BORDER-LEFT: #2b1083 1px solid; BORDER-TOP: #2b1083 1px solid; BORDER-RIGHT: #2b1083 1px solid}TH {TEXT-ALIGN: center; BORDER-LEFT: #a6a6c9 1px solid; PADDING-BOTTOM: 2px; PADDING-LEFT: 1px; PADDING-RIGHT: 1px; BACKGROUND: #2b1083; COLOR: white; FONT-SIZE: 0.8em; FONT-WEIGHT: bold; PADDING-TOP: 2px}TH.first {TEXT-ALIGN: left; BORDER-LEFT: 0px; PADDING-BOTTOM: 2px; PADDING-LEFT: 1px; PADDING-RIGHT: 1px; FONT-SIZE: 0.8em; PADDING-TOP: 2px}TR {BACKGROUND: #fff}TR.alt {BACKGROUND: #f6f5f9}TD {TEXT-ALIGN: center; BORDER-LEFT: #a6a6c9 1px solid; PADDING-BOTTOM: 2px; PADDING-LEFT: 1px; PADDING-RIGHT: 1px; COLOR: #000; FONT-SIZE: 0.8em; PADDING-TOP: 2px}TD.alt {BACKGROUND-COLOR: #f6f5f9}TD.bold {FONT-WEIGHT: bold}TH.date {FONT-SIZE: 0.7em}TD.first {TEXT-ALIGN: left}TD.left {TEXT-ALIGN: left}TD.bleft {TEXT-ALIGN: left; FONT-WEIGHT: bold}
It's been a while since I last covered the EUR/USD a month ago, in fact. It's just that there's been so much terrific tramline, Fibonacci and Elliott waveaction in gold and the Dow recently that the euro's been crowded out.
But today could be a critical time for the euro, as I'll explain a little later. Let me set the scene.
MoneyWeek
Subscribe to MoneyWeek today and get your first six magazine issues absolutely FREE

Sign up to Money Morning
Don't miss the latest investment and personal finances news, market analysis, plus money-saving tips with our free twice-daily newsletter
Don't miss the latest investment and personal finances news, market analysis, plus money-saving tips with our free twice-daily newsletter
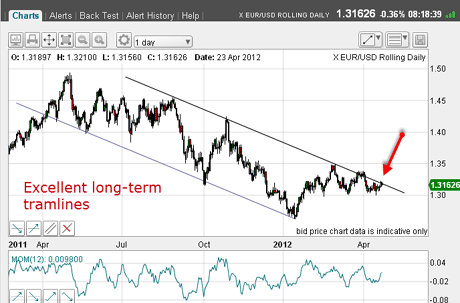
A month ago, the euro was finishing up a wedge-shaped consolidation phase and was butting up against the major tramline on the daily chart:

(Click on the chart for a larger version)
The question then was: Will it or won't it?
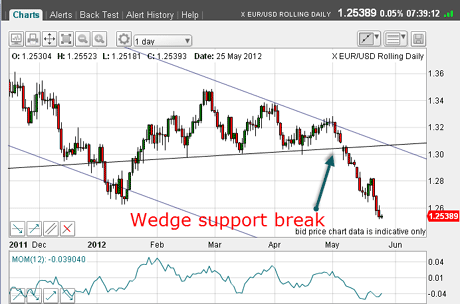
In the end, the lower wedge support line broke. Not surprising, given the weight of huge selling, induced by the bearish noises emanating from the eurozone particularly.
So how's the euro looking now? This daily chart shows the situation this morning:

(Click on the chart for a larger version)
A sensible policy would have been to set entry sell-stops just below the wedge line around the 1.30 area. Being short is definitely the correct stance, so far.
You can see that the decline away from the wedge has been very sharp and relentless. The fall to the 1.25 area has also taken it to below January's major low, which confirms the major downtrend.
Everyone is short the euro
But as the decline gathered pace, the good ship euro is listing heavily to port, as every trader and his dog has rushed to the bear side! The euro is rapidly losing what friends it had on the starboard side. If this keeps up, the ship will capsize.
What trader wants to be long the euro? Surely, everyone knows the eurozone will break apart soon. Catastrophe! It's certain, isn't it? The story is all over the world's media. Who could possibly disagree?
Well, if I am to retain my contrarian credentials, I need to look for reasons to cover my shorts and even, dare I say it, go long.
And first off, here is one reason the latest Commitments of Traders (COT) data on the make-up of the futures market:
| (CONTRACTS OF EUR 125,000) OPEN INTEREST: 356,674 | ||||||||
| COMMITMENTS | ||||||||
| 38,475 | 212,344 | 1,668 | 286,563 | 66,730 | 326,706 | 280,742 | 29,968/ | 75,932 |
| CHANGES FROM 05/08/12 (CHANGE IN OPEN INTEREST: 35,637) | ||||||||
| 2,453 | 32,338 | 220 | 33,965 | -2,982 | 36,638 | 29,576 | -1,001 | 6,061 |
| PERCENT OF OPEN INTEREST FOR EACH CATEGORY OF TRADERS | ||||||||
| 10.8 | 59.5 | 0.5 | 80.3 | 18.7 | 91.6 | 78.7 | 8.4 | 21.3 |
| NUMBER OF TRADERS IN EACH CATEGORY (TOTAL TRADERS: 190) | ||||||||
| 29 | 89 | 16 | 48 | 42 | 88 | 136 | Row 8 - Cell 7 | Row 8 - Cell 8 |
Recall, the non-commercials are the large speculators hedge funds, bank trading desks, and so on. The non-reportables are the small traders.
Just compare the relative holdings of the large specs the bears have 5.5 contracts to each bull. And similarly with the small specs the bears have 2.5 contracts to each bull.
And note the week's changes a 15% increase in large specs bearish bets, and an 8% increase in small specs bearish bets.
What we can see is that traders large and small filled their boots with bearish bets in the week ending 15 May.
If my memory serves, this is the identical set-up at the $1,920 gold top last summer. Hmm.
And as the market has fallen since 15 May, we can be assured this situation is even more extreme.
Five reasons there could be a bounce in the euro
To my mind, this data proves the extreme bearishness in the market and could possibly be the full extent of it.
But as we all know, surely, just as one opinion prevails with such overwhelming force, that is the time the market usually surprises. Remember, markets exist to punish the majority.
The bears must be getting really comfortable with their positions as the market has fallen by over five cents in a month. That is long enough to become complacent, especially with the chorus of doom and gloom getting louder seemingly by the day as the day of reckoning approaches.
This is a classic herding behaviour.
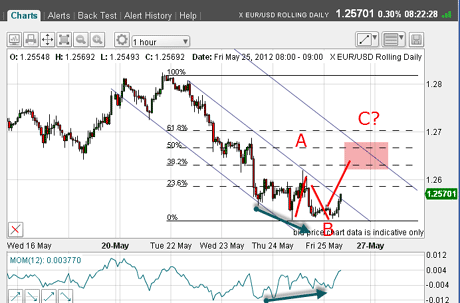
So, at this point, I like to look at the charts. Here is the 15-minute chart as I write:

(Click on the chart for a larger version)
Several points:
1.Positive momentum divergence (green arrows) at yesterday's low Bullish
2.Possible A-B-C pattern forming and in C wave Bullish
3.Tramline break Bullish
4.Can there be any new shorts left out there? Bullish
5.The Dow is currently finding support, so the euro should follow Bullish
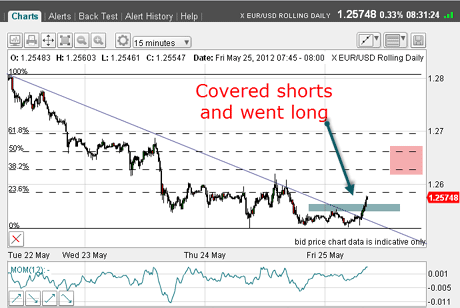
That is why I placed protect-profit buy stops in the market this morning. Where, I hear you ask? Let's zoom in:

(Click on the chart for a larger version)
This is the 15-minute chart showing a nice rally above this morning's minor high marked by the grey bar in the 1.2550 area.
With that move, I took a substantial profit from my short trade, and I am now long and protected by my close stop.
What should I expect to see now? With the market working its way through the overhead resistance from yesterday, I expect some backing and filling this morning.
But I expect to see a quick move up to my Fibonacci/tramline target area (pink box). If this occurs, that would place yesterday's congestion zone now as support previously resistance. This is the key event for my bullish case.
If the market follows this roadmap, a further rally to the 1.27 area becomes feasible. With the market so heavily short, very sharp rallies become entirely probable. This move could surprise a lot of traders.
We shall see.
If you're a new reader, or need a reminder about some of the methods I refer to in my trades, then do have a look at my introductory videos:
The essentials of tramline trading
An introduction to Elliott wave theory
Advanced trading with Elliott waves
Don't miss my next trading insight. To receive all my spread betting blog posts by email, as soon as I've written them, just sign up here .
Get the latest financial news, insights and expert analysis from our award-winning MoneyWeek team, to help you understand what really matters when it comes to your finances.
John is is a British-born lapsed PhD physicist, who previously worked for Nasa on the Mars exploration team. He is a former commodity trading advisor with the US Commodities Futures Trading Commission, and worked in a boutique futures house in California in the 1980s.
He was a partner in one of the first futures newsletter advisory services, based in Washington DC, specialising in pork bellies and currencies. John is primarily a chart-reading trader, having cut his trading teeth in the days before PCs.
As well as his work in the financial world, he has launched, run and sold several 'real' businesses producing 'real' products.
-
 ISA fund and trust picks for every type of investor – which could work for you?
Whether you’re an ISA investor seeking reliable returns, looking to add a bit more risk to your portfolio or are new to investing, MoneyWeek asked the experts for funds and investment trusts you could consider in 2026
-
 The most popular fund sectors of 2025 as investor outflows continue
It was another difficult year for fund inflows but there are signs that investors are returning to the financial markets