The euro bounces off chart support – which way now?
With so much going on in Europe, the currency markets are gearing up for some truly large-scale action. John C Burford looks for clues to which way the euro is going to go next.
Get the latest financial news, insights and expert analysis from our award-winning MoneyWeek team, to help you understand what really matters when it comes to your finances.
You are now subscribed
Your newsletter sign-up was successful
Want to add more newsletters?

Twice daily
MoneyWeek
Get the latest financial news, insights and expert analysis from our award-winning MoneyWeek team, to help you understand what really matters when it comes to your finances.

Four times a week
Look After My Bills
Sign up to our free money-saving newsletter, filled with the latest news and expert advice to help you find the best tips and deals for managing your bills. Start saving today!
It's all happening in Europe! The French presidential elections have been getting exciting over the weekend and there's the budget impasse in the Netherlands.
With all this going on, I'm expecting some truly large-scale action this week in the EUR/USD.
And I'll also be paying extra close attention to my other main markets. I expect recent market indecision in gold and the Dow to be resolved.
MoneyWeek
Subscribe to MoneyWeek today and get your first six magazine issues absolutely FREE

Sign up to Money Morning
Don't miss the latest investment and personal finances news, market analysis, plus money-saving tips with our free twice-daily newsletter
Don't miss the latest investment and personal finances news, market analysis, plus money-saving tips with our free twice-daily newsletter
I'll be keeping right up-to-date with developments. And what I see in the charts should be great for helping you understand my trading methods and how you can use them to profit.
OK, now let's get to the charts and what's happening to the EUR/USD.
Euro bounces off solid chart support
When I last covered the euro on 16 April, I noted that the market was trending down but was likely to encounter support at the big round-number 1.30 level. And that's exactly what happened, with the euro managing a rally to over 1.32 on Friday.
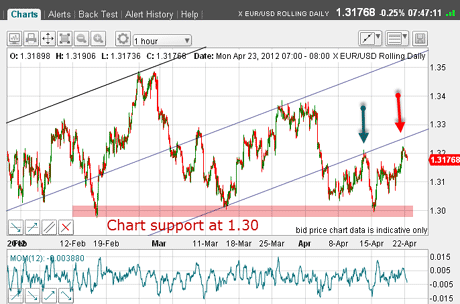
This is this morning's updated chart:

(Click on the chart for a larger version)
Last Monday, the market had rallied to the underside of my lowest tramline(blue arrow). It was pushed back down from that and was challenging the 1.30 level, where it met good support (pink bar). You can see the two previous attempts to break this support in mid-February and in mid-March.
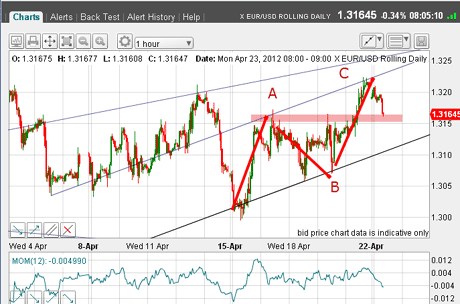
There are two aspects to last week's rally to Friday's 1.32 high. First, the form of the rally is a nice A-B-C(see next chart). The second aspect is that the rally has fallen short of the lowest tramline. That could prove fatal for the bullish cause.
Let's zoom in a bit for a close-up of this action:

(Click on the chart for a larger version)
The A-B-C has nice proportions and I can draw a tramline across the A and C wave tops, which also pass nicely through several PPPs (prior pivot points) on the left of the chart. Recall, I put great store in these PPPs.
So, with a nice C wave, I had a great point to take a short trade, anticipating the market to respect that top and to decline from there. And I could also place my protective stop very close in the 1.3260 area for a low-risk trade.
So, with a good upper tramline, I drew my lower line through the B wave low. That will be my first line of defence in the case of the market falling back to challenge this line.
But first, if it is to decline, it must eat through the support from trading put in between the A and B waves. I have drawn a pink bar to indicate chart support from the two minor peaks of last week. Normally, I would expect a bounce up off this support, but if it does not occur, the omens are not good for the bulls.
Of course, a break of the lower tramline would be very bearish. I will be looking at placing short-entry stop orders if this looks likely.
This longer-term chart shows the euro at a critical level
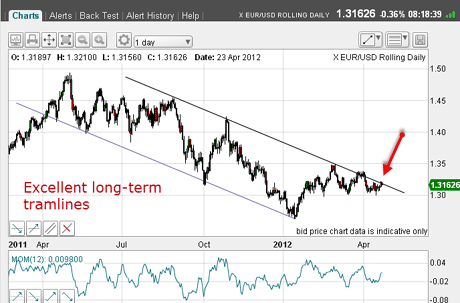
At times like this, I like to keep an eye on the long-term picture. When trading short-term, it is easy to lose sight of the forest for the trees. Here is the daily chart going back a year:

(Click on the chart for a larger version)
As you can see, I have a terrific tramline pair which takes in most of the major highs and lows in the year.
But the fact is, the market is making its third hit of the upper tramline from underneath (red arrow). Sometimes, third times are lucky!
So, as I see it this morning, the market could either punch up past that upper tramline and head quickly higher. Or it could bounce off it and break below the 1.30 level.
Decision time is approaching. Where do you think it's heading? Share your thoughts below.
If you're a new reader, or need a reminder about some of the methods I refer to in my trades, then do have a look at my introductory videos:
The essentials of tramline trading
An introduction to Elliott wave theory
Advanced trading with Elliott waves
Don't miss my next trading insight. To receive all my spread betting blog posts by email, as soon as I've written them, just sign up here .
Get the latest financial news, insights and expert analysis from our award-winning MoneyWeek team, to help you understand what really matters when it comes to your finances.
John is is a British-born lapsed PhD physicist, who previously worked for Nasa on the Mars exploration team. He is a former commodity trading advisor with the US Commodities Futures Trading Commission, and worked in a boutique futures house in California in the 1980s.
He was a partner in one of the first futures newsletter advisory services, based in Washington DC, specialising in pork bellies and currencies. John is primarily a chart-reading trader, having cut his trading teeth in the days before PCs.
As well as his work in the financial world, he has launched, run and sold several 'real' businesses producing 'real' products.
-
 ISA fund and trust picks for every type of investor – which could work for you?
Whether you’re an ISA investor seeking reliable returns, looking to add a bit more risk to your portfolio or are new to investing, MoneyWeek asked the experts for funds and investment trusts you could consider in 2026
-
 The most popular fund sectors of 2025 as investor outflows continue
It was another difficult year for fund inflows but there are signs that investors are returning to the financial markets