You are now subscribed
Your newsletter sign-up was successful
Want to add more newsletters?

Twice daily
MoneyWeek
Get the latest financial news, insights and expert analysis from our award-winning MoneyWeek team, to help you understand what really matters when it comes to your finances.

Four times a week
Look After My Bills
Sign up to our free money-saving newsletter, filled with the latest news and expert advice to help you find the best tips and deals for managing your bills. Start saving today!
The Dow has gapped up in overnight markets, just as it did last Monday. By gapped up' I mean it's opened up substantially higher than Friday's close. Could this be a new pattern?
With the Greek elections now out of the way but with no sign of a resolution of the euro crisis the Dow has reacted again to historic political events.
MoneyWeek
Subscribe to MoneyWeek today and get your first six magazine issues absolutely FREE

Sign up to Money Morning
Don't miss the latest investment and personal finances news, market analysis, plus money-saving tips with our free twice-daily newsletter
Don't miss the latest investment and personal finances news, market analysis, plus money-saving tips with our free twice-daily newsletter
Politics is not my beat, though. So let's get straight to what the charts are telling me this morning.
The Dow follows my road Elliott wave road map
In my last post on the Dow, I wrote:
" I believe the odds favour a move up beyond Monday's high:
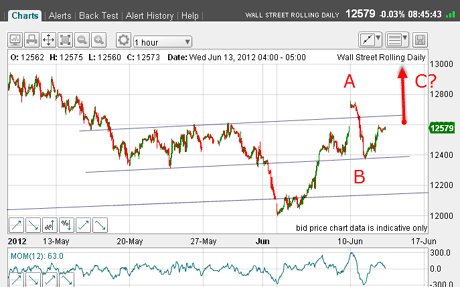
(Click on the chart for a larger version)
"This is my tentative roadmap with the C wave ending above the A wave before the bear market resumes. If so, more short squeezing lies ahead.
"Now let's have a look at what this implies in the four-hour chart:
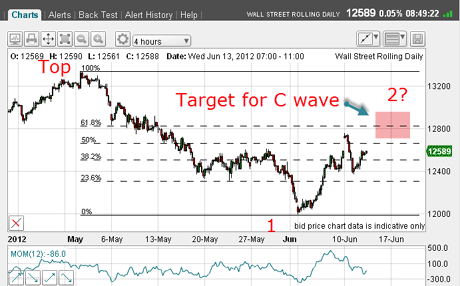
(Click on the chart for a larger version)
"If a new high lies ahead, my target zone surrounds the Fibonacci 62% retrace, preferably accompanied by a negative momentum divergence."
And this morning, I can say that my roadmap has been followed to the letter.
Here is the current chart:
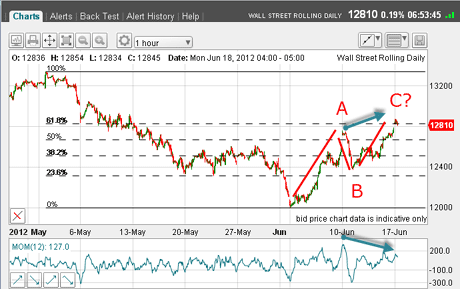
(Click on the chart for a larger version)
I have my A-B-C with the C wave showing a large negative momentum divergence (blue arrows) on the hourly chart and a push to the Fibonacci 62% retrace.
OK, the question is: Is this it? Is the market ready for a big downside move?
Sentiment survey shows a big swing to the bullish side
Recall, my roadmap also calls for a huge third wave down after the C wave top is in place. I have not traded this rally as I have been awaiting a top to short.
Last week, I showed the AAII survey results on the US stock market, which showed a very nervous public. The swings between bullish and bearish have been wild of late. To me, this highlights the extreme state of manic depression out there something I spoke about in my presentation at the MW Conference last month.
Stock market bulls are saying stocks are historically cheap and the Fed will be forced to create more stimulus. The bears point to the deteriorating economic backdrop with prices under pressure and economic growth poor. The market has been pulled from pillar to post in these mood swings.
What are the latest AAII readings? As of June 13, we have:
| Row 0 - Cell 0 | Row 0 - Cell 1 | Row 0 - Cell 2 | Row 0 - Cell 3 |
| Bulls | 34% | 7% | 39% |
| Bears | 36% | -10% | 30% |
| Neutral | 30% | 3% | 31% |
Just look at the change in the bear camp a full 10% decrease! That is the short squeeze I have mentioned with a vengeance. It certainly vindicated my decision to take profits on my short trade previously.
But now, with bears in retreat and the bull camp swelling, has the rally done its time-honoured job of trapping the bulls right at a top?
What does the short-term chart tell me, if anything?
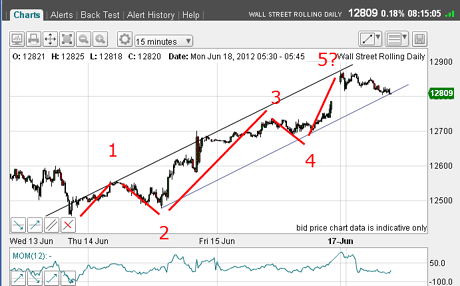
(Click on the chart for a larger version)
Quite a lot, actually!
Leading up to my possible C wave, I can count a five-wave form. It is not perfect, but has the characteristics of a completed five-wave pattern. Remember, fifth waves are ending waves prior to a reversal.
I also have a reasonable tramline pair. Currently, we are trading right on the lower tramline. A break here should confirm the top in the Dow.
My three possible targets for a big fall in the Dow
Remember, I'm not recommending a trade for you here. I'm just showing you my thinking, using the techniques I use to trade. And for me, the odds are excellent that my C? wave has likely come to an end at this morning's gap high at 12,870.
If I am correct, where are my possible downside targets?
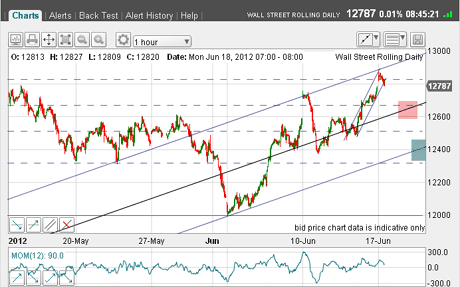
(Click on the chart for a larger version)
I have drawn in three pretty good tramlines. The upper one is very good with a PPP and waves A and C tops as touch-points. My lowest tramline I have drawn through the 4 June low and the centre tramline has a few good touch-points.
My first downside target is my pink bar at the 12,650 area and my second is my blue bar at the 12,450 area.
Of course, I will be looking for a break of the 4 June low at the 12,000 area at some stage and that could occur sooner rather than later.
Will my luck hold? We'll see in the next day or so
Trader tip: Using basic Elliott wave theory, as I have done here, can give a clear roadmap to base forecasts for future price and time targets. This can give traders greater confidence in trades. If the market does not conform to it, it's likely that something else is going on and the charts should be re-examined. But if the market obeys the script, then the odds are very much on the trader's side and the trigger can be pulled.
This summer is shaping up to be a hot one at least in the markets. Will you make money from it? If you apply the rules and strategies I'm writing about, you have a good chance.
If you're a new reader, or need a reminder about some of the methods I refer to in my trades, then do have a look at my introductory videos:
The essentials of tramline trading
An introduction to Elliott wave theory
Advanced trading with Elliott waves
Don't miss my next trading insight. To receive all my spread betting blog posts by email, as soon as I've written them, just sign up here .
-
 Average UK house price reaches £300,000 for first time, Halifax says
While the average house price has topped £300k, regional disparities still remain, Halifax finds.
-
 Barings Emerging Europe trust bounces back from Russia woes
Barings Emerging Europe trust has added the Middle East and Africa to its mandate, delivering a strong recovery, says Max King

