What’s happening to global stock markets?
A surprise shock to the world order is always going to upset the markets, says John C Burford. And that’s exactly what we’re witnessing.
Get the latest financial news, insights and expert analysis from our award-winning MoneyWeek team, to help you understand what really matters when it comes to your finances.
You are now subscribed
Your newsletter sign-up was successful
Want to add more newsletters?

Twice daily
MoneyWeek
Get the latest financial news, insights and expert analysis from our award-winning MoneyWeek team, to help you understand what really matters when it comes to your finances.

Four times a week
Look After My Bills
Sign up to our free money-saving newsletter, filled with the latest news and expert advice to help you find the best tips and deals for managing your bills. Start saving today!
As a technical trader, I have to keep an eye on the large global, macro, political and economic developments. A surprise' shock to the world order is always going to impact the financial markets. And that is what we are witnessing today.
Global tensions are ratcheting up with the Ukraine situation pitting Russia against the West. The world is nervously waiting to see what form the promised US sanctions against Russia will take. Whatever they are, they are negative for bullish sentiment.
Also in the mix is the ongoing tension between China and Japan over a disputed set of islands. This has already unleashed age-old resentments.
MoneyWeek
Subscribe to MoneyWeek today and get your first six magazine issues absolutely FREE

Sign up to Money Morning
Don't miss the latest investment and personal finances news, market analysis, plus money-saving tips with our free twice-daily newsletter
Don't miss the latest investment and personal finances news, market analysis, plus money-saving tips with our free twice-daily newsletter
This is what happens in a bear market a move from co-operation towards belligerence. In the background there is the weakening global economic growth picture and a further move towards a deflationary scenario with retail and producer prices falling. Here in the UK, supermarkets have promised an all-out war on prices.
These are all warnings of a looming credit crunch of gigantic proportions.
Today, I will venture a little off piste and analyse a few global stock indexes and compare them with the Dow, which I covered on Friday. I had come to the conclusion that we have likely entered a third wave down off the 7 March top.
The fundamental driver of stock markets
When they are bullish, they use lots of borrowed funds to purchase more shares than they could using only their cash balances. With interest rates low, there has been great incentive to leverage to the max and that is the position today.
The downside for the institutions is that when prices fall, their losses are magnified. This results in coordinated panic selling - but we are not there yet.
In the short term, markets can display different wave patterns, many of which can be labelled as Elliott waves. In this way, when there is a major turn each market reaches it in different ways and at different times.
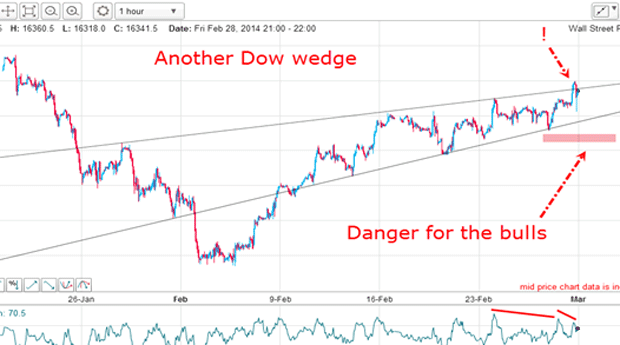
I will show you what I mean, but first here is a chart I took of the Dow before it made its 7 March top:

I identified a very clear wedge on the hourly, which had solid lines of resistance and support. I had an exclamation point on the 28 February action, since that was possibly an overshoot', indicating buying exhaustion.
If buying had indeed become exhausted, a move down past the lower wedge line into my pink danger zone' would greatly heighten the probability that a top was near. And we got that break past the danger zone last week.
But can this topping action be confirmed by other major global markets?
What the DAX can tell us about panic selling

The DAX represents some of the strongest companies in the eurozone. It should therefore be more immune to nervous selling than markets in weaker eurozone economies.
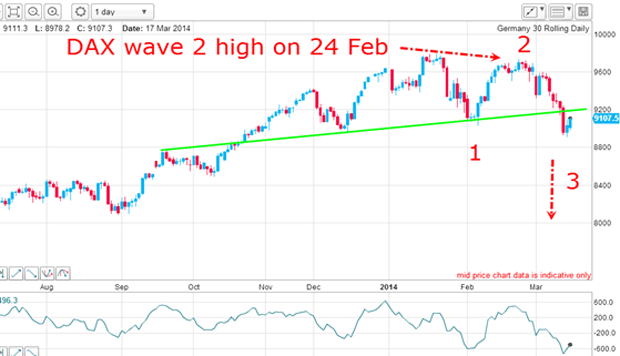
The index has a very similar appearance to that of the Dow, but the wave 2 high topped on 24 February and was already in decline when the Dow's wave 2 was topping.
The all-time high was made on 17 January, which still leaves the pattern open to an A-B-C interpretation (as it does in the Dow).
But in the DAX chart, the market has broken below an important line of support (green line) and is currently moving up for a kiss.
Here, the market has two options. If the market can break strongly above this line, that would increase the odds on this A-B-C idea.
But if it kisses the line and enters a scalded cat bounce down, then we will almost certainly be in a third wave down. So I have a point on the chart where I can now try to forecast the next move.
Economists made a big mistake (again)

The Hong Kong market has vast exposure to the Chinese economy, of course. And China surprised last week with a shock miss on February exports by a whopping 25% below expectations. Yes, that is no typo a 25% miss of the economists' forecast.
If I were one of these economists, I would be looking for another career.
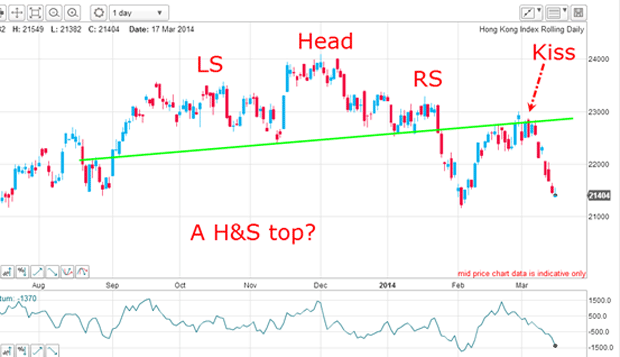
I can draw a head and shoulders top complete with neckline (green line). The market has broken this neckline, made a kiss and now is in a scalded cat bounce. This is a textbook H&S reversal pattern.
Note that the kiss occurred around the date of the Dow wave 2 high and was a terrific place to enter low-risk short trades. In fact, this kiss was another signal that the Dow was likely topping. It was also a further piece of evidence to support a short stance in the Dow.
The real reason markets are down

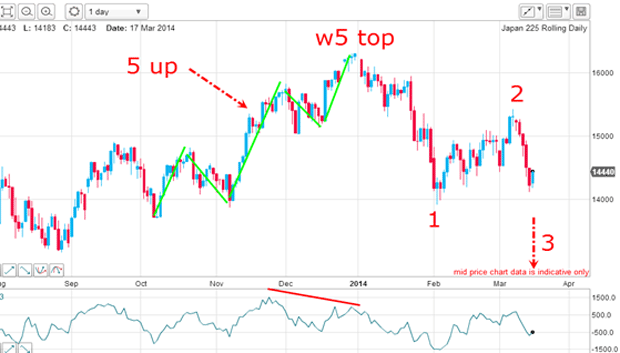
The move up to the 31 December top is a classic impulsive five-wave affair, complete with a large negative-momentum divergence at the wave 5 top.
The market then descended in wave 1, followed by a rally in wave 2. It is currently in wave 3 down. Note that the wave 2 high completed a precise Fibonacci 62% retrace of wave 1. That was a textbook short trade entry. This wave 2 top occurred on 7 March the very same day as the wave 2 high in the Dow.
Now we have broadly similar down moves in all of these indexes all connected by the common thread of credit availability. In fact, outstanding debt/credit in the private (corporate) sector, as opposed to the government sector, is finally declining after many decades of constant growth. Now it's only governments that are adding to their debt loads.
And it is this reduction in private debt that is driving global stock markets lower. That is the only data point to focus on in the months ahead. The unrest in Ukraine is only a symptom of the declines not the cause.
Get the latest financial news, insights and expert analysis from our award-winning MoneyWeek team, to help you understand what really matters when it comes to your finances.
John is is a British-born lapsed PhD physicist, who previously worked for Nasa on the Mars exploration team. He is a former commodity trading advisor with the US Commodities Futures Trading Commission, and worked in a boutique futures house in California in the 1980s.
He was a partner in one of the first futures newsletter advisory services, based in Washington DC, specialising in pork bellies and currencies. John is primarily a chart-reading trader, having cut his trading teeth in the days before PCs.
As well as his work in the financial world, he has launched, run and sold several 'real' businesses producing 'real' products.
-
 ISA fund and trust picks for every type of investor – which could work for you?
Whether you’re an ISA investor seeking reliable returns, looking to add a bit more risk to your portfolio or are new to investing, MoneyWeek asked the experts for funds and investment trusts you could consider in 2026
-
 The most popular fund sectors of 2025 as investor outflows continue
It was another difficult year for fund inflows but there are signs that investors are returning to the financial markets