Has the Dow Jones already peaked?
We may have seen a major top in the Dow Jones, says John C Burford. The path of least resistance is now down.
Get the latest financial news, insights and expert analysis from our award-winning MoneyWeek team, to help you understand what really matters when it comes to your finances.
You are now subscribed
Your newsletter sign-up was successful
Want to add more newsletters?

Twice daily
MoneyWeek
Get the latest financial news, insights and expert analysis from our award-winning MoneyWeek team, to help you understand what really matters when it comes to your finances.

Four times a week
Look After My Bills
Sign up to our free money-saving newsletter, filled with the latest news and expert advice to help you find the best tips and deals for managing your bills. Start saving today!
Should we beware the Ides of March? So warned the soothsayer to Julius Caesar in 44 BC. He should have taken note because, according to Shakespeare, he was assassinated on that very date (which falls tomorrow this year).
That soothsayer could make a lot of money if he were around today and appeared on CNBC. And all the other stock market pundits would quickly be out of a job.
As a soothsayer of the markets, I don't have that 100% record. But before I left for my break, I did make a case that stocks would very probably make highs in the month of March.
MoneyWeek
Subscribe to MoneyWeek today and get your first six magazine issues absolutely FREE

Sign up to Money Morning
Don't miss the latest investment and personal finances news, market analysis, plus money-saving tips with our free twice-daily newsletter
Don't miss the latest investment and personal finances news, market analysis, plus money-saving tips with our free twice-daily newsletter
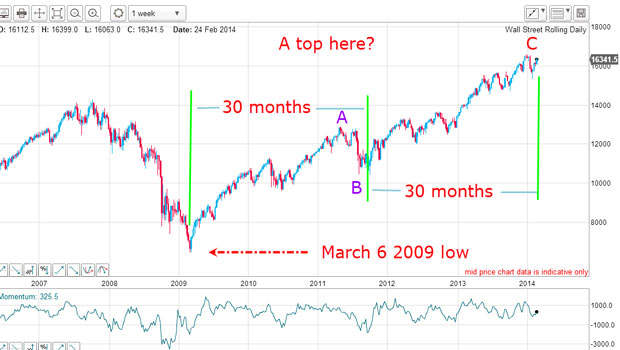
This is the weekly chart of the Dow that I made on 24 February:

My basic premise was this: From the 2007 highs, I can count a clear five-wave impulsive wave patterndown to the March 2009 low at the 6,500 level. That date is highly significant.
I can make two projections from this low. First, the next major move would be an upward corrective move. Second, this move would likely be in an A-B-C form.
It has taken five years almost to the day to produce this picture of a textbook A-B-C relief rally pattern.
My question is: Why has it taken so very long to stretch out this relief rally? For bears such as myself, it was been an agonising time, although there have been some terrific shorting opportunities along the way.
Blame it all on QE
To me, the reason is encapsulated in only one factor quantitative easing (QE). This mammoth increase in funds available for stock speculation started from the depths of the credit crunch. And it has encouraged financial institutions to jump on the stock market bandwagon in an effort to repair the damage done to their firms by the credit implosion.
And as markets recovered, sentiment has followed to the point now where we are seeing bubble-like behaviour in many sectors.
But what is fascinating to me in the above chart is that the major low of the relief rally (my B wave low) occurred precisely 30 months from the March 2009 low.
The best cycles are the ones that fly under the radar
This is an example of the use of cycles. The study of cycles is a well-researched area in the past. If you analyse historic charts, you will quickly find many examples of patterns being repeated in a cyclical manner. At one time, the four-year stock market cycle was a popular topic. This pattern coincided with major tops and bottoms four years apart.
Lately, virtually no-one is talking about cycles and that's because the consensus believes stocks are on an ever-upward path. To me, that is a clear warning sign that cycles are quietly operating under the radar and my new discovery may indeed be one in operation right now.
The key point about cycles is that they only work when very few analysts notice them. When a particular cycle is splashed around in the media, it is best to reject it as a basis for forecasting.
One way to keep track of the popularity of cycles is to scan the new book releases. If there are few on cycles, then your time is well spent in searching for them!
How to find that major monthly top
So if I am looking for a major stock market top this month, is there more evidence that another index can tell me?
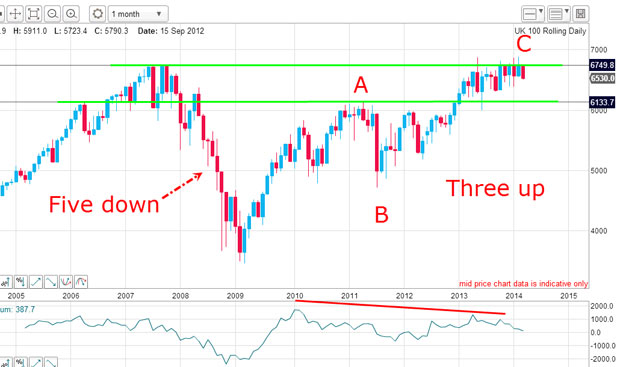
Here is the monthly FTSE chart. Often, the monthly chart can reveal clues that shorter-term charts miss.

Just as in the Dow, there is a well-defined five-wave impulsive pattern off the 2007 highs to the March 2009 low, and the relief rally is in a clear A-B-C.
The 2007 highs were in the 6,800 area, and in the last few months the market has rallied to this region. But note that every time it has poked above the 6,800 parapet, it has been shot back down into the trenches. The pigtails of the past few months give the game away.
This means the market considers the 6,800 level as very strong resistance.
Also, the lower line represents supportbecause I have drawn it across two major tops. The market is currently trading inside the zone between the support and resistance levels. Once it breaks free, the moves should be dramatic.
What QE and tapering mean for the markets
Note the important momentumreadings the maximum for the rally occurred in early 2010 over four years ago! And since then, the rally has been sustained on a steadily weakening buying power. That is one powerful demonstration of the declining effect of QE. As the added QE liquidity since inception has had a gradually declining supportive effect on the GDP of the USA, so it has on the stock market. Also in the mix is the Fed's current tapering policy, thereby reducing even further the stimulus effect.
Are there any shorter-term clues as to immediate direction?

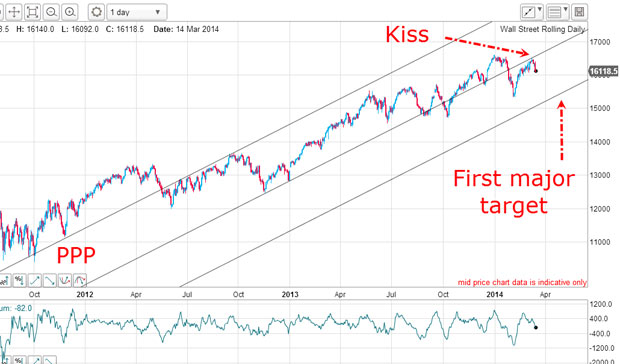
Here is a tramlinetrio that I am working on the daily Dow. The upper line has a terrific prior pivot pointfrom October 2011 and clips the important highs in late 2012.
Also, there was an important high on 22 May 2012. If you were reading my articles at the time, you will recall that I identified that top and an excellent short trade resulted.
But in the past few days, the market has made a kiss on the underside of my centre tramline and is backing off it very sharply in textbook scalded cat'fashion. This action supports my contention that we have indeed seen a major top already this month and the path of least resistance is now down.
Although the Ides of March fall tomorrow, is the Dow high on 7 March just one week early from that fateful day?
Get the latest financial news, insights and expert analysis from our award-winning MoneyWeek team, to help you understand what really matters when it comes to your finances.
John is is a British-born lapsed PhD physicist, who previously worked for Nasa on the Mars exploration team. He is a former commodity trading advisor with the US Commodities Futures Trading Commission, and worked in a boutique futures house in California in the 1980s.
He was a partner in one of the first futures newsletter advisory services, based in Washington DC, specialising in pork bellies and currencies. John is primarily a chart-reading trader, having cut his trading teeth in the days before PCs.
As well as his work in the financial world, he has launched, run and sold several 'real' businesses producing 'real' products.
-
 Average UK house price reaches £300,000 for first time, Halifax says
While the average house price has topped £300k, regional disparities still remain, Halifax finds.
-
 Barings Emerging Europe trust bounces back from Russia woes
Barings Emerging Europe trust has added the Middle East and Africa to its mandate, delivering a strong recovery, says Max King