Using Fibonacci to trade gold
A showcase example of the power of Fibonacci levels enables John C Burford to take profits in the gold market.
Get the latest financial news, insights and expert analysis from our award-winning MoneyWeek team, to help you understand what really matters when it comes to your finances.
You are now subscribed
Your newsletter sign-up was successful
Want to add more newsletters?

Twice daily
MoneyWeek
Get the latest financial news, insights and expert analysis from our award-winning MoneyWeek team, to help you understand what really matters when it comes to your finances.

Four times a week
Look After My Bills
Sign up to our free money-saving newsletter, filled with the latest news and expert advice to help you find the best tips and deals for managing your bills. Start saving today!
I'm going to talk about the gold market again today, because it's a great demonstration of how to trade using Fibonacci levels.
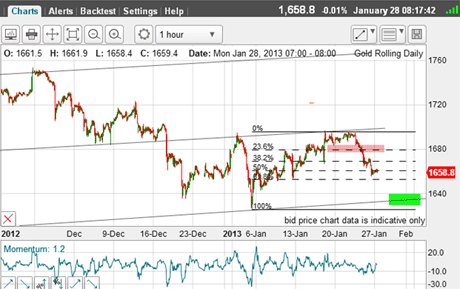
On Monday, the market was declining off a very significant internal trend line just under the $1,700 level and heading for the early January low near $1,625.
But to get there, it had to negotiate the Fibonacci retrace levels that I showed on the chart below.
MoneyWeek
Subscribe to MoneyWeek today and get your first six magazine issues absolutely FREE

Sign up to Money Morning
Don't miss the latest investment and personal finances news, market analysis, plus money-saving tips with our free twice-daily newsletter
Don't miss the latest investment and personal finances news, market analysis, plus money-saving tips with our free twice-daily newsletter
Remember, Fibonacci levels are normally very reliable price points where bounces can originate or start an actual resumption of the uptrend. And these price points are flagged in advance provided you have applied your Fibonacci tool promptly after the turn down from the high.

(Click on the chart for a larger version)
With this advance warning, you will be prepared for likely scenarios.Of course, markets can fall right through these levels and often do in a fast-moving market.But at least, they provide a roadmap for you.
The moment of truth
In the above chart, the market plunged right past the 23% level, paused at the 38% and was hitting the 50% level.
This was the moment of truth, since reversals often occur at this 50% level.
I was watching this like a hawk on Monday.

(Click on the chart for a larger version)
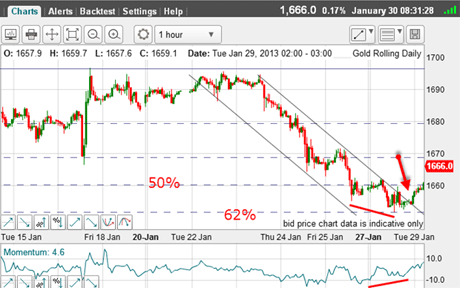
Late in the day, I saw the market zig-zag around the 50% level. I was then able to draw in my first tramline (upper one), and when the market made a lunge for the 62% level on a pigtail, I suspected that this level would hold and support a decent bounce, at least.
Also, I noted the positive-momentum divergence on this hourly chart (my favoured time scale for short-term timing of entry).
Time to look for a long trade.
When the market broke up through my tramline, that was my signal (red arrow).
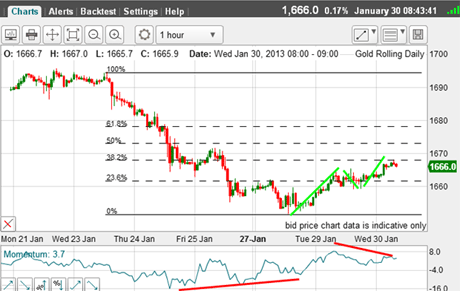
OK, if we were to see at least a good bounce, I want to get my Fibonacci levels with pivot points obtained on the drop from the $1,695 high and Monday's low:

(Click on the chart for a larger version)
And here they are on this current chart.
I have my bounce and I am long, but my question is:will it carry on further?
It has already overcome resistance at the 23% level and is currently challenging the 38% level, where there is chart resistance from last Thursday/Friday.
I have also noted the ominous-looking A-B-C form to this rally (green arrows) accompanied by another ominous-looking negative-momentum divergence.
So this morning, discretion being the better part of valour, I have taken profits on my long trade.
So what's next? Should I go short here, looking for a move down to my main target just under $1,640? That's my big question for the next few days in this market.
If you're a new reader, or need a reminder about some of the methods I refer to in my trades, then do have a look at my introductory videos:
The essentials of tramline trading
An introduction to Elliott wave theory
Advanced trading with Elliott waves
Don't miss my next trading insight. To receive all my spread betting blog posts by email, as soon as I've written them, just sign up here . If you have any queries regarding MoneyWeek Trader, please contact us here.
Get the latest financial news, insights and expert analysis from our award-winning MoneyWeek team, to help you understand what really matters when it comes to your finances.
John is is a British-born lapsed PhD physicist, who previously worked for Nasa on the Mars exploration team. He is a former commodity trading advisor with the US Commodities Futures Trading Commission, and worked in a boutique futures house in California in the 1980s.
He was a partner in one of the first futures newsletter advisory services, based in Washington DC, specialising in pork bellies and currencies. John is primarily a chart-reading trader, having cut his trading teeth in the days before PCs.
As well as his work in the financial world, he has launched, run and sold several 'real' businesses producing 'real' products.
-
 ISA fund and trust picks for every type of investor – which could work for you?
Whether you’re an ISA investor seeking reliable returns, looking to add a bit more risk to your portfolio or are new to investing, MoneyWeek asked the experts for funds and investment trusts you could consider in 2026
-
 The most popular fund sectors of 2025 as investor outflows continue
It was another difficult year for fund inflows but there are signs that investors are returning to the financial markets