I monitor the financial media and the blogs to try to catch the mood in the gold market.As I never tire of saying, gold is the most emotional of markets and swings up and down much more on sentiment than on the fundamentals'.
In fact, over the years, I have found that most of the time the basic supply/demand datais so confusing as to be of no use to me in predicting market direction.For those that can benefit, there is a pile of such data available, from mine production data to demand for jewellery to central bank purchases/sales.
At times, of course, we have a major theme that is driving prices.We saw that in the 1970s when inflation was rampant and well into double digits, and investors were buying gold as a hedge to protect their buying power. That is what drove the incredible bull market that peaked at $850.
Try 6 free issues of MoneyWeek today
Get unparalleled financial insight, analysis and expert opinion you can profit from.

Sign up to Money Morning
Don't miss the latest investment and personal finances news, market analysis, plus money-saving tips with our free twice-daily newsletter
Don't miss the latest investment and personal finances news, market analysis, plus money-saving tips with our free twice-daily newsletter
And more recentlybetween 2008and2011, investors bought gold because they feared inflation as a consequence of loose monetary policy.With so much more money in the system, surely inflation was inevitable.

We are seeing no signs of consumer inflation. What inflation does exist is confined to the financial markets and possibly US real estate (again).
That puts the gold market in a quandary.If the primary reason to accumulate gold is inflation, and there's no inflation, why continue to hold it when other assets are flying?
What do the charts say?
The last time I covered gold was on 16 January: Is your trading psychology set for success?Then, the market was toying with the upper $1,700 target, which I had in place since early January.
We had a bounce off a major tramline and $1,700 was a reasonable place to suspect a turn.
In the event, the market fell just $5 shy of my target and this is why:
(Click on the chart for a larger version)
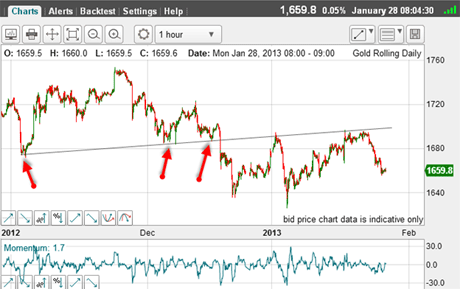
I have a superb tramline on this hourly chart with those three accurate prior pivot points(PPPs). As the market made its second attempt on the $1,700 area, it banged into this line, which proved too much for it.
Recall, I had another tramline pair working at the time.This is a wonderful example - when working with tramlines, it always pays to look for alternative lines.This one is truly reliable because of those PPPs and the overhead resistance from the congestion zone formed from December's trading.
In any case, in terms of the volatile nature of gold, I reckon my target was hit.
As you know, I am a long-term gold bear and so wish to trade mostly from the short side and this was just the excuse I needed!
But is my new tramline really reliable, despite proving its resistive credentials here?
I believe so, and this is why:
(Click on the chart for a larger version)
I can draw my upper tramline passing through the significant November high, and I can draw the lower tramline across the significant early January low!The lines are equidistant, as required.
How's that for precision?How did the early January plunge know when to stop at my tramline (that I had not then drawn)?Recall, it also stopped right on one of my long-term tramlines (see 16 January post).That price, $1,626, is very significant. And markets have memories sometimes, very long ones.
Our next target
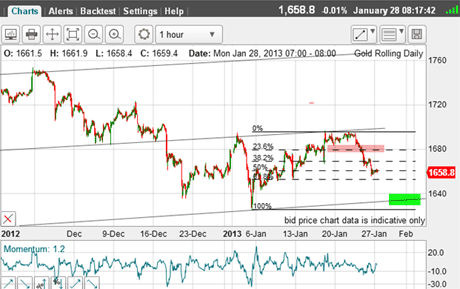
OK, the market backed off from the $1,700 area and a short trade was indicated on a break of the minor lows (pink bar) with a protective stop just above the recent high.
The target is then the lower tramline around $1,640 (green bar).
I have placed the Fibonacci levels on this year's rally to give me an idea of either pausing zones, or places where the market, if it so wishes, is likely to turn.
Trader tip: When you see such a situation as this, where a rally (or dip) is followed by a dip (or rally), get your Fibonacci tool working right away.Then, you will have your price levels to watch for possible bounces or reversals.Being prepared is much better than being surprised!
Note that the market last week paused at the 38% level before falling to the current 50% level a typical support level.
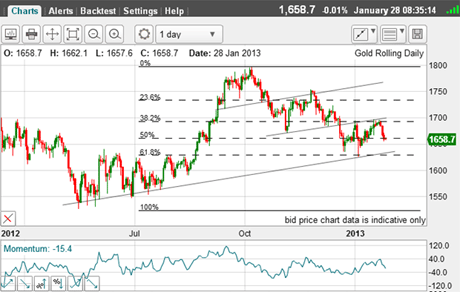
One of the most important tasks in tramline trading is to go back in the chart in time to see if there are any more touch points (or PPPs). If there are, you have a very significant set of tramlines.
This is the result of going to the daily chart and doing just that:
(Click on the chart for a larger version)
Right away, my lower tramline extended back passes right across the multiple lows last summer!That is very gratifying.
Trader tip: Perform the same task on all of your charts just go back in time to check for more proof that you really are working with reliable tramlines.
Also, I have applied the Fibonacci levels to the entire rally from last summer to the October $1,796 top.
And right away, we see that the early January plunge low to $1,626 was turned right at the 62% level. Yet another reason, in addition to those I mentioned above, to suspect this is a very critical level for gold.
Breaking this level should be highly significant and islikely toherald a move towards my major $1,500 - $1,530 target area eventually.
But, what are the options in the near-term?
We are mid-way between tramlines and eating into chart support.
If the centre tramline resistance at the $1,700 region can hold, then the odds favour a challenge on the lower tramline target at the $1,640 level.
But I detected a shift away from a bearish sentiment last week to a more bullish stance and the latest Commitment of Traders (COT) data supports this view.
| OPEN INTEREST: 461,369 | ||||||||
| COMMITMENTS | ||||||||
| 195,795 | 43,898 | 46,176 | 153,048 | 348,998 | 395,019 | 439,072 | 66,350 | 22,297 |
| CHANGES FROM 01/15/13 (CHANGE IN OPEN INTEREST: 13,596) | ||||||||
| 2,840 | -3,941 | 11,630 | -2,962 | 7,875 | 11,508 | 15,564 | 2,088 | -1,968 |
| PERCENT OF OPEN INTEREST FOR EACH CATEGORY OF TRADERS | ||||||||
| 42.4 | 9.5 | 10.0 | 33.2 | 75.6 | 85.6 | 95.2 | 14.4 | 4.8 |
| NUMBER OF TRADERS IN EACH CATEGORY (TOTAL TRADERS: 338) | ||||||||
| 193 | 63 | 77 | 60 | 49 | 289 | 163 | Row 8 - Cell 7 | Row 8 - Cell 8 |
The week's shifts are instructive! Basically, speculators have increased their longs/decreased their shorts, while the trade have done the reverse.
This, just before a rather large $40+ decline in the gold price. That's called timing bad timing. But par for the course. And for traders who do not run with the herd, a gift.
If you're a new reader, or need a reminder about some of the methods I refer to in my trades, then do have a look at my introductory videos:
The essentials of tramline trading
An introduction to Elliott wave theory
Advanced trading with Elliott waves
Don't miss my next trading insight. To receive all my spread betting blog posts by email, as soon as I've written them, just sign up here . If you have any queries regarding MoneyWeek Trader, please contact us here.