Using Fibonacci targets to short the euro and the Dow
Following on from his look at the euro and the Dow Jones markets, John C Burford spots an opportunity to make a short trade as the two diverge.
Get the latest financial news, insights and expert analysis from our award-winning MoneyWeek team, to help you understand what really matters when it comes to your finances.
You are now subscribed
Your newsletter sign-up was successful
Want to add more newsletters?

Twice daily
MoneyWeek
Get the latest financial news, insights and expert analysis from our award-winning MoneyWeek team, to help you understand what really matters when it comes to your finances.

Four times a week
Look After My Bills
Sign up to our free money-saving newsletter, filled with the latest news and expert advice to help you find the best tips and deals for managing your bills. Start saving today!
Market developments came thick and fast on Wednesday afternoon, as I suspected in my previous email. Within a few hours of writing that, there was a resolution to my dilemma whether to trade or not.
If you recall, I wrote: "the Dow has hit an exact Fibonacci target, but is shy of my tramline target. And the euro has hit my tramline target, but is somewhat short of my Fibonacci retrace target."
But now (as of Wednesday June 1) the euro has hit the Fibonacci 50% retrace at 1.4450 (the actual high this afternoon has been just eight pips overshoot).
MoneyWeek
Subscribe to MoneyWeek today and get your first six magazine issues absolutely FREE

Sign up to Money Morning
Don't miss the latest investment and personal finances news, market analysis, plus money-saving tips with our free twice-daily newsletter
Don't miss the latest investment and personal finances news, market analysis, plus money-saving tips with our free twice-daily newsletter
So now all Fibonacci levels and tramline targets have been hit.
The euro and the Dow diverge
Curiously, while the euro was moving up to the 50% level at 1.4450, the Dow was in steep decline. This surprised me, as the markets had been moving pretty much in lock-step.
Something was up.
All I can say is that this incident illustrates the power of the markets to overcome just about everything and make it to its Fibonacci retraces and then reverse.
To actually see it happen in real time is very exhilarating.
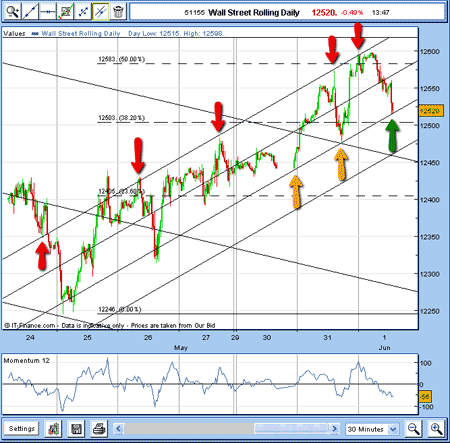
Now I can draw some tramlines since we have more highs and lows to use and here is the Dow chart as I write:

(Click on the chart for a larger version)
On my first tramline, I can draw lines across the recent highs with good touch-points - marked in red arrows.
The next tramline is the line second-from-bottom and it also passes through two important lows, marked with yellow arrows. As I write, the market is resting right on this line (green arrow).
The central tramline has some good touch-points and I will now draw the lowest tramline equidistant from that.
This will give me a first target in case the market decides to keep moving down.
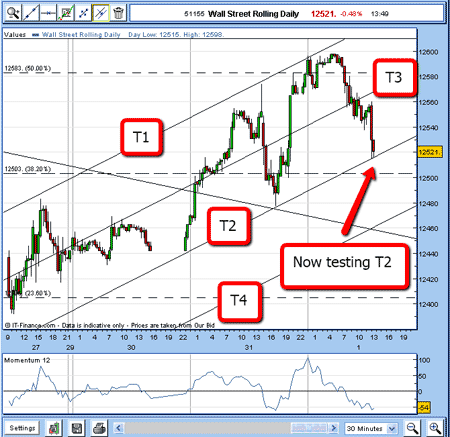
I have zoomed in with a 30-minute chart and have marked the four tramlines:

(Click on the chart for a larger version)
The market is now challenging T2, and if it gives way, I can expect a move down to T4.
Note also the low at the 15:00 hour on 1 June at 12,475. There will be many sell stops there, I feel. A move to that level should trigger all those sell stops and propel the market down further.
The tramlines indicate a short sale
So a short sale just below T2 is indicated. Naturally, my 3% rule for protective stop placement should be employed if this order is filled.
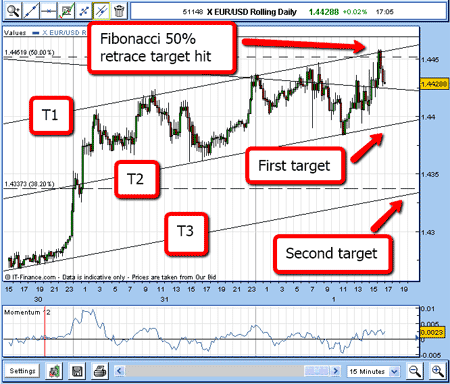
So we have the Dow at a critical juncture, what is the state of play over in the euro? Here is the chart:

(Click on the chart for a larger version)
While the Dow was falling, the euro was completing its mission of making the summit at the 1.4450 level. (I did say that this level was to be critical.)
Note there is a slight overshoot of my tramline.
Remember, one of my rules of thumb is that when you see an overshoot of a well-constructed tramline following a strong directional move, it usually indicates a reversal is at hand.
Even if not, you can still short on the overshoot using a close protective stop and expect at least a dip which enables you to move your stop to break even using my break-even rule.
This helps protect capital a very good thing.
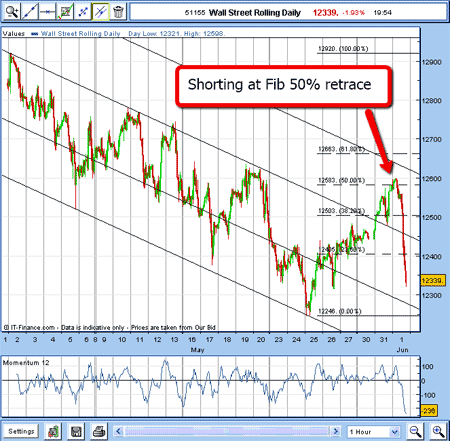
This is how Dow trading ended on Wednesday:

(Click on the chart for a larger version)
Of course, short-term traders would be looking to take profits before the close.
Believers in my tramline methods could be shorting the euro here at the upper tramline around 1.4450, using a close 35 pip protective stop.
My targets? They are at the tramline levels, as shown.
The next few hours should see things move very quickly. I expect to write more on the Dow and euro very soon, so watch this space.
But by the time you read this, the charts will almost certainly look very different!
Get the latest financial news, insights and expert analysis from our award-winning MoneyWeek team, to help you understand what really matters when it comes to your finances.
John is is a British-born lapsed PhD physicist, who previously worked for Nasa on the Mars exploration team. He is a former commodity trading advisor with the US Commodities Futures Trading Commission, and worked in a boutique futures house in California in the 1980s.
He was a partner in one of the first futures newsletter advisory services, based in Washington DC, specialising in pork bellies and currencies. John is primarily a chart-reading trader, having cut his trading teeth in the days before PCs.
As well as his work in the financial world, he has launched, run and sold several 'real' businesses producing 'real' products.
-
 Average UK house price reaches £300,000 for first time, Halifax says
While the average house price has topped £300k, regional disparities still remain, Halifax finds.
-
 Barings Emerging Europe trust bounces back from Russia woes
Barings Emerging Europe trust has added the Middle East and Africa to its mandate, delivering a strong recovery, says Max King