The benefits of patience when looking for an entry point
The euro and the US stockmarket have been moving in tandem lately. John C Burford examines whether looking at one market can lead to an entry point to short the other.
Get the latest financial news, insights and expert analysis from our award-winning MoneyWeek team, to help you understand what really matters when it comes to your finances.
You are now subscribed
Your newsletter sign-up was successful
Want to add more newsletters?

Twice daily
MoneyWeek
Get the latest financial news, insights and expert analysis from our award-winning MoneyWeek team, to help you understand what really matters when it comes to your finances.

Four times a week
Look After My Bills
Sign up to our free money-saving newsletter, filled with the latest news and expert advice to help you find the best tips and deals for managing your bills. Start saving today!
In my last post, I used the recent action in the EUR/USD as a terrific working example of how I use my trading methods in particular, how I use a combination of Fibonacci retrace levels with my own tramline targets.
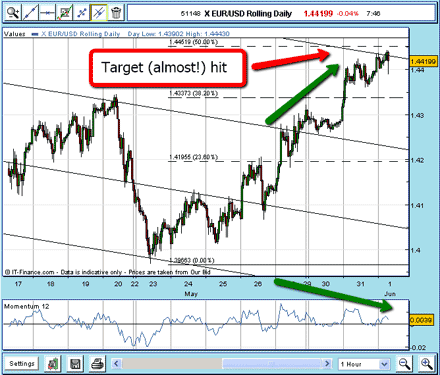
On the last chart, I projected the 1.4450 level would be a major target. At this level, the rally would carry to the Fibonacci 50% retrace of the big move down from 1.49 to the recent low at 1.39.
The euro nears my target
This morning (Wednesday), I saw that the high overnight has been just a few pips short of my target, and the market is currently toying with it as I write.
MoneyWeek
Subscribe to MoneyWeek today and get your first six magazine issues absolutely FREE

Sign up to Money Morning
Don't miss the latest investment and personal finances news, market analysis, plus money-saving tips with our free twice-daily newsletter
Don't miss the latest investment and personal finances news, market analysis, plus money-saving tips with our free twice-daily newsletter

(Click on the chart for a larger version)
So is this a good place to short?
Recall that I mentioned previously that the euro and the Dow have been moving more or less in lock-step. Apparently, the herd believes that stocks should be bought whenever the dollar declines.
My interpretation of this is that the market believes that, through the quantitative easing (QE) dollar-printing process and the stated aim of the Fed to support equities, more (and cheaper) dollars mean higher equity prices. All of this in the face of a far from solid US economic recovery.
Add in the current wobbles in China and the sovereign debt crisis in the eurozone, and there seems precious little fundamental reason to buy stocks for the long pull.
That is the backdrop for the huge stock rally into early May and highlights the dilemma facing stock investors.
Can the euro tell us when to short the Dow?
But back to the technical picture.
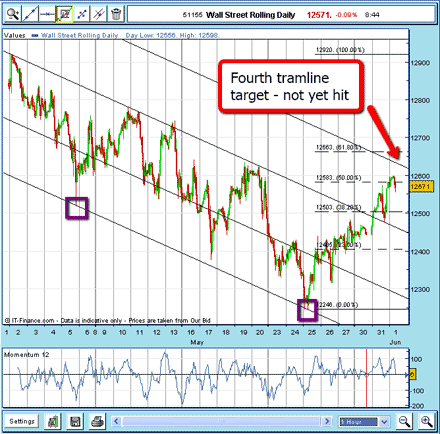
So let's have a look at the Dow. Here is the latest hourly chart:

(Click on the chart for a larger version)
There are several very important features I wish to point out.
First, I drew the first tramline across the tops from early May this is the third-from-bottom line. Note the solid touch-points. This tramline is the equivalent of the similar one in the euro chart.
Also, note the break-through in the early hours of 31 May and the pull-back right to the upper side of the line and then a 'scalded cat bounce' up to its current levels.
This is classic market behaviour.
Second, I drew my lowest tramline right through the two solid lows of 5 and 25 May (marked with purple boxes). That is a very solid tramline.
Note that before the 25 May low was put in, we could have forecast that low just from those two tramlines!
Third, I drew my third tramline mid-way between these first two lines, and then I drew my fourth tramline equidistant above my third-from-bottom line.
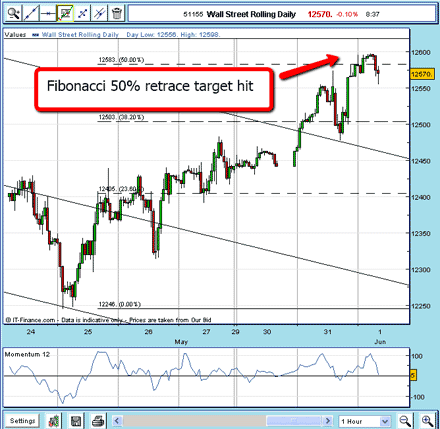
I have drawn in my Fibonacci levels and this morning, the market has hit my 50% retrace target.

(Click on the chart for a larger version)
So to sum up, as of this morning, the Dow has hit an exact Fibonacci target, but is shy of my tramline target. And the euro has hit my tramline target, but is somewhat short of my Fibonacci retrace target.
At this point, a trader weighs all of this up, and acts (or not!).
For myself, I will just observe the action as it develops today and wait for a definite signal. At the back of my mind lurks the warning from the sudden turnaround in bullish sentiment towards the dollar in late May, which I mentioned in my last post. This could result in a deeper upward retrenchment in the euro a short squeeze.
I decide to watch and wait at least for a while.
NB: Don't miss my next trading insight. To receive all my spread betting blog posts by email, as soon as I've written them, just sign up here .
Get the latest financial news, insights and expert analysis from our award-winning MoneyWeek team, to help you understand what really matters when it comes to your finances.
John is is a British-born lapsed PhD physicist, who previously worked for Nasa on the Mars exploration team. He is a former commodity trading advisor with the US Commodities Futures Trading Commission, and worked in a boutique futures house in California in the 1980s.
He was a partner in one of the first futures newsletter advisory services, based in Washington DC, specialising in pork bellies and currencies. John is primarily a chart-reading trader, having cut his trading teeth in the days before PCs.
As well as his work in the financial world, he has launched, run and sold several 'real' businesses producing 'real' products.
-
 Average UK house price reaches £300,000 for first time, Halifax says
While the average house price has topped £300k, regional disparities still remain, Halifax finds.
-
 Barings Emerging Europe trust bounces back from Russia woes
Barings Emerging Europe trust has added the Middle East and Africa to its mandate, delivering a strong recovery, says Max King