The right trading system
Pundits and traders all have their theories as to what drives the markets. But the only information worth listening to is what the charts tell you. John C Burford explains.
Get the latest financial news, insights and expert analysis from our award-winning MoneyWeek team, to help you understand what really matters when it comes to your finances.
You are now subscribed
Your newsletter sign-up was successful
Want to add more newsletters?

Twice daily
MoneyWeek
Get the latest financial news, insights and expert analysis from our award-winning MoneyWeek team, to help you understand what really matters when it comes to your finances.

Four times a week
Look After My Bills
Sign up to our free money-saving newsletter, filled with the latest news and expert advice to help you find the best tips and deals for managing your bills. Start saving today!
I have been tracking the Dow for signs of a top since my lastpost on 11 February: We're not far from a market turn. On Wednesday, I spotted the confirmation that the turn was in. I'll get to that later.
With the Dow down 200 pips from Wednesday's top at 14,060 I have to ask a tricky question. If the market has turned from up to down, what were the factors that changed the situation?
Every trader will answer that according to the theory he/she holds about what really drives the markets.
MoneyWeek
Subscribe to MoneyWeek today and get your first six magazine issues absolutely FREE

Sign up to Money Morning
Don't miss the latest investment and personal finances news, market analysis, plus money-saving tips with our free twice-daily newsletter
Don't miss the latest investment and personal finances news, market analysis, plus money-saving tips with our free twice-daily newsletter
I'm sure you have seen a market that, for no apparent reason, makes a major top or bottom and youhave been left scratching your head wondering what changed? I know I have before I started studying Elliott waves, that is.
Of course, the pundits are full of logical explanations after the event. Sadly, I have yet to discover a way to make any money on that move after it has occurred.
Naturally, we all have our theories on what drives the stock market. Some say it is earnings. Others say it is the force of excess buying over selling (in a bull run) the popular 'wall of money' theory. Yet others believe the media drives the markets. That's the story the mainstream media like to tell about themselves, and I have no time for it.
In the 1970s, the popular theory was that stock movements are random - the 'random walk' theory. This was during a time when stocks were range-bound.
And among economists, there is no general consensus on what drives the stock market. Best not to follow them, then.
Scaling the wall of money
Let's examine briefly the 'wall of money' theory. On the surface, it makes sense (as all theories do if they support your investments!). The money sitting on the sidelines has to go somewhere, surely?
Interest rates are zilch, gold is collapsing, bonds are too expensive, and commodities are also expensive. So, what is left?
OK, so what is the mechanism that determines the price?
The last trade is always between a willing buyer and a willing seller. They each had their different motives for this trade, of course. The buyer might be a short covering their position or a genuine buyer who believes the stock isa good investment from a value or dividend perspective.
The seller may have a good profit already and has located a better placefor the funds. They believe there is not much left to go for, andare willing to take the profit. Or it may be a new short who believes the stock will decline.
The price they agree is the latest price. The seller would prefer a higher price and the buyer a lower one. But they compromise and settle.
Now another seller comes along and makes an offer, or a buyer makes a bid. The potential buyers see that offer and if one of them likes it, they will trade at that price, which may be higher or lower than the previous one. Then the potential sellers see that price, and if they like it, they will make their offers. And if the sellers are more persistent than the buyers, the trade prices will fall.
Be aware that all traders follow historical price movements and most base their decisions on what the price has done already. A high price will bring out many sellers, while a low price will attract many buyers. That is why markets move in waves.
All trades are made at the margin between a very small number of traders who hold positions or who want positions. The bulk of positions, long or short, are not trading.
Be aware that this wall of money is not forced to move! If enough traders who control this money believe they had better sit tight in cash - since they are wary of making a wrong move they will not invest. That is a function of their sentiment, and as we know, sentiment can be monitored.
And even if some of this wall of money does filter into stocks, will it overpower any selling? The theory takes no account of the other side of the trades!
The forecasting system that works
The only theory that makes any sense to me is Elliott wave theory, which is an empirical observational system for forecasting market moves and turns based on many decades of experience.
And below is a chart showing the short-term waves that conform precisely to the Elliott wave principles.
I recommend all traders become familiar with at least the main principles it could change the way you view markets.
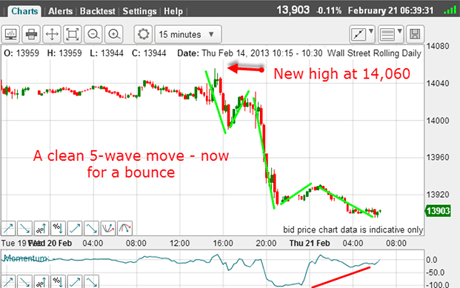
And the one piece of evidence I was looking for yesterday was a small-scale five-wave move to the downside off a new Dow high.
This is the chart I took off my screen early yesterday:

(Click on the chart for a larger version)
This little pattern tells me all I want to know that we have a clear five-wave move with a long and strong third wave off a new high for the bull run off the 2009 low. This indicates the trend is now down.
Now, why was I looking for a Dow top around this date?
A mirror image pattern in Europe
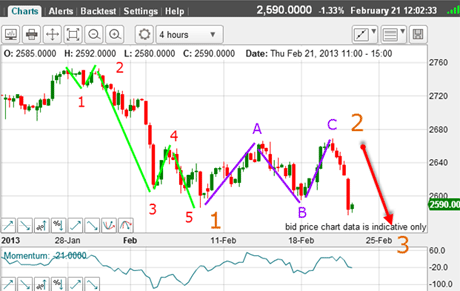
Simply because I found an identical pattern in a major European stock index last month in the Euro STOXX 50! This index comprises the 50 largest-cap stocks in Europe. It is known as the 'European Dow'.
Here is the pattern I found:

(Click on the chart for a larger version)
This market topped on 28 January, almost a month ago! There is a clear five-wave move down off the all-time high and a textbook A-B-C counter-trend rally.
Yesterday, the market broke below the wave 1 low to confirm this interpretation and we are currently in large wave 3 down.
Because the economic downturn originated in Europe, it is only fitting that this market should have turned first.
To confirm this Elliott wave interpretation, I will need to see a rapid move down.
And so since early February, I have been not very patiently waiting for this move to be replicated in the Dow.
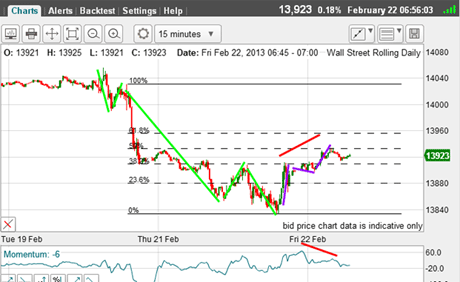
And this morning, it appears I have my confirmation and here is the 15-minute chart:

(Click on the chart for a larger version)
I have my five waves down and we are currently in a textbook A-B-C up to the Fibonacci 50% retrace and on a large negative-momentum divergence.
Compare this chart with the above Euro STOXX chart they are almost identical in their Elliott waves.
There are no guarantees in the markets, but this is about as good as it gets for a trade set-up.
What would be your trade here? And where would you place your protective stop?
If you're a new reader, or need a reminder about some of the methods I refer to in my trades, then do have a look at my introductory videos:
The essentials of tramline trading
An introduction to Elliott wave theory
Advanced trading with Elliott waves
Don't miss my next trading insight. To receive all my spread betting blog posts by email, as soon as I've written them, just sign up here . If you have any queries regarding MoneyWeek Trader, please contact us here.
Get the latest financial news, insights and expert analysis from our award-winning MoneyWeek team, to help you understand what really matters when it comes to your finances.
John is is a British-born lapsed PhD physicist, who previously worked for Nasa on the Mars exploration team. He is a former commodity trading advisor with the US Commodities Futures Trading Commission, and worked in a boutique futures house in California in the 1980s.
He was a partner in one of the first futures newsletter advisory services, based in Washington DC, specialising in pork bellies and currencies. John is primarily a chart-reading trader, having cut his trading teeth in the days before PCs.
As well as his work in the financial world, he has launched, run and sold several 'real' businesses producing 'real' products.
-
 Average UK house price reaches £300,000 for first time, Halifax says
While the average house price has topped £300k, regional disparities still remain, Halifax finds.
-
 Barings Emerging Europe trust bounces back from Russia woes
Barings Emerging Europe trust has added the Middle East and Africa to its mandate, delivering a strong recovery, says Max King