As you know, I am a chart trader. That simply means I trade off the signals the market generates on the charts using my tramline, Fibonacci and Elliott wave methods.
I believe that because all traders are human (even those that programme the algo computers!) It is the fluctuating tension between buyers and sellers that creates price patterns. Specifically, the relative sentiment swings of participants makes the market. And these patterns are repeated, time and time again, often in clear Elliott waves.
All economic reports and data have to be interpreted, and there is no one correct objective way to perform this task. What is bullish to one may be bearish to another. And that is what makes a market.
Try 6 free issues of MoneyWeek today
Get unparalleled financial insight, analysis and expert opinion you can profit from.

Sign up to Money Morning
Don't miss the latest investment and personal finances news, market analysis, plus money-saving tips with our free twice-daily newsletter
Don't miss the latest investment and personal finances news, market analysis, plus money-saving tips with our free twice-daily newsletter
I advise every trader and investor to make market judgements based on what others are doing, not on your own views of what the data means.

If you believe a report is bullish, and the market reacts negatively, you will lose money on your long trades. But if you hold an agnostic view and observe how the market reacts to a report, and then make your trade, you will make many more winning trades. And I hope that this is your objective.
You should never fight the markets. Period. They are always right.
One other thing do not make the common mistake of believing that the markets make sentiment. It is the reverse.
Here is just one quote from a prominent blogger: "Yet, that was enough to restore confidence in Spanish and other GIIPS block bonds. Their yields fell, confidence increased, and the EUR began its rally based on this presumed reduced solvency threat."
This puts the cart before the horse. Sentiment makes the buying and selling decisions the correct statement should read: "Confidence increased, and their yields fell".
Although I trade off the charts', I do follow many internal market readings. You can gain useful insight into the health of a market by monitoring sentiment data.
For example, I often quote the AAII.com weekly poll of US retail investors' attitude to stocks, which lately has been reading bullish'.
Another measure of sentiment is US mutual fund (the equivalent of our unit trusts) money flows. Mutual funds have been the vehicle of choice for equity investments for private US investors for decades, and there are firms that follow the flows of money in (positive investments), and money out (redemptions).
Obviously, when investors are largely bullish, money will flow in and vice versa.
Here is a most amazing chart of mutual fund money flows (courtesy elliottwave.com):
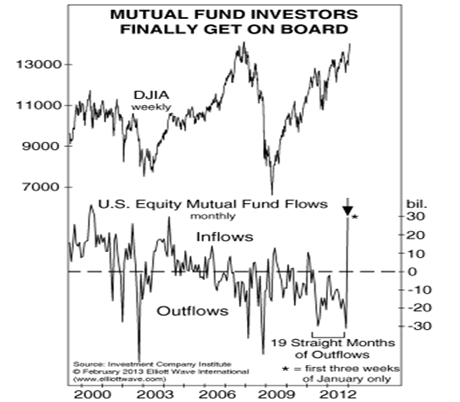
Source: Investment Company Institute
I want you to study this chart. If you are bullish on shares, it should cause you to question your stance! You are in the company of retail investors who have just seen the light, and who were wrong for the past three years.
For me, the most important feature is the fact that retail investors have been selling their investments since April 2011 for 19 straight months. All the while, the Dow was in a massive rally!
Talk about the public being on the wrong side of the market.
They sold for17 months into December. Then at the new year they suddenly saw the error of their ways and fell over themselves to buy back the units they had previously sold... after the rally!
In one month (and this data only shows the first three weeks of January), they switched from a near-record redemption in December to a near-record investment in January. In fact, when all the data is in, it would not surprise me if a new record was made.
From max bearish to max bullish in one month that must be a record.
For me, it says only one thing the bear market cannot be far away.
The Dow approaches my target
So let's get to the Dow, which I last covered on4 January as it began its assault on my tramline target in the 14,000 area:
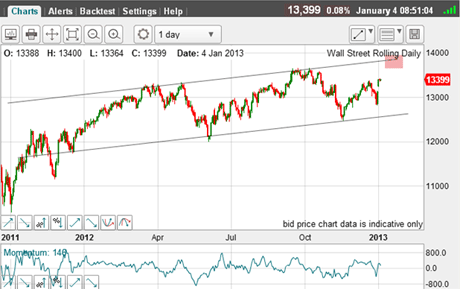
(Click on the chart for a larger version)
This was the picture back then, and since then, the market rallied to hit my target:
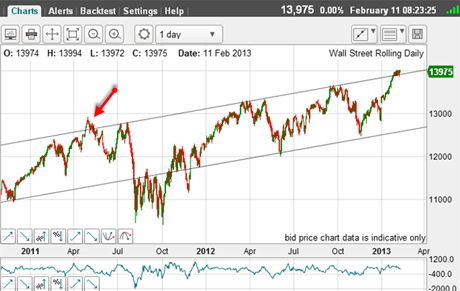
(Click on the chart for a larger version)
Now, these are very long-term tramlines, but I believe they are still operating.
The market has poked slightly above the upper tramline, but to nothing like the extent of the May 2011 overshoot (red arrow).
The big question is: Is this a genuine tramline breakout heralding significant new highs?
The majority of traders, advisors and money managers think so. Bullish sentiment is at or near record highs. Even long-term bears have thrown in the towel.
What a perfect set-up for a top!
Let's zoom in to the 15-minute chart:
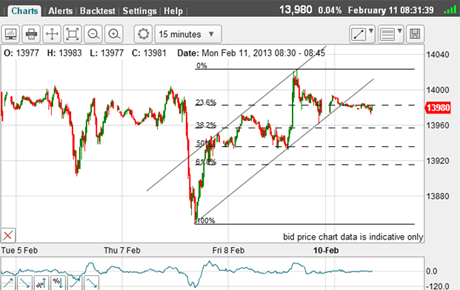
(Click on the chart for a larger version)
I have a superb tramline pair with many touch points, and a break of the lower tramline.
What would be your trade?
If you're a new reader, or need a reminder about some of the methods I refer to in my trades, then do have a look at my introductory videos:
The essentials of tramline trading
An introduction to Elliott wave theory
Advanced trading with Elliott waves
Don't miss my next trading insight. To receive all my spread betting blog posts by email, as soon as I've written them, just sign up here . If you have any queries regarding MoneyWeek Trader, please contact us here.