The moment of truth is at hand
The rally in the Dow has hit a brick wall. Can it punch through? John C Burford scours the charts for an answer.
Get the latest financial news, insights and expert analysis from our award-winning MoneyWeek team, to help you understand what really matters when it comes to your finances.
You are now subscribed
Your newsletter sign-up was successful
Want to add more newsletters?

Twice daily
MoneyWeek
Get the latest financial news, insights and expert analysis from our award-winning MoneyWeek team, to help you understand what really matters when it comes to your finances.

Four times a week
Look After My Bills
Sign up to our free money-saving newsletter, filled with the latest news and expert advice to help you find the best tips and deals for managing your bills. Start saving today!
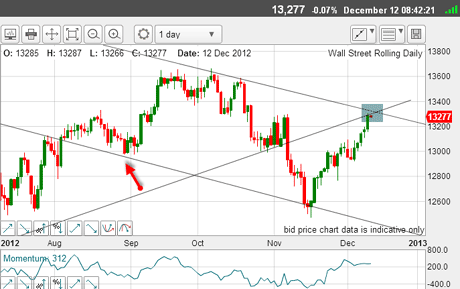
When I last covered the Dow on 12 December, the market was rallying towards the crossing of a major tramline and the up-sloping trendline:

(Click on the chart for a larger version)
Since then, the market collapsed just before Christmas, but is now in strong rally mode (see below chart).
MoneyWeek
Subscribe to MoneyWeek today and get your first six magazine issues absolutely FREE

Sign up to Money Morning
Don't miss the latest investment and personal finances news, market analysis, plus money-saving tips with our free twice-daily newsletter
Don't miss the latest investment and personal finances news, market analysis, plus money-saving tips with our free twice-daily newsletter
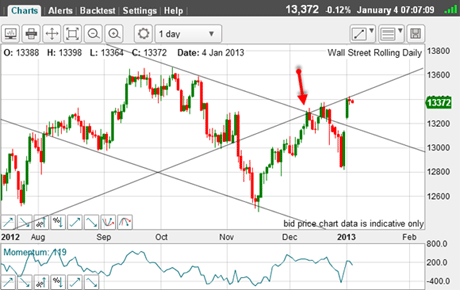
Following my post, the market did hit my upper tramline (red arrow), backed off for a couple of days, and then poked above the line.
It then fell sharply down to the 12,800 area prior to the fiscal cliff' denouement on 1 January.
I had taken short positions in the 13,300 area in the region of the second red arrow and was enjoying the ride down over the holidays.

(Click on the chart for a larger version)
But my enjoyment was short-lived when the market suddenly reversed to stop me out at break-even. I was certainly glad I was using my break-even rule, as no damage was done to my account.
My win-win strategy
In fact, I had an ace up my sleeve just in case the market did reverse.
That ace was the 30-year T-Bond market. Before Christmas, I had taken a short position in the bonds as a hedge. I felt that if the fiscal cliff drama would be bullish for stocks, then it wouldprobably be bearish for bonds particularly now that T-Bond yields were near record lows. That would be the classic risk-on scenario.
Sometime in January, I hope to cover the T-Bonds, as I believe this market is ripe for some major moves.
T-Bond yields have been driven down by the flight to safety as well as the huge Fed purchase programme. But with bonds yielding less than the current inflation rate, it was only a matter of time before investors woke up and realised they held instruments of mass confiscation!
That meant my break-even result in the Dow was compensated by a major gain on my short T-Bond trade. That was a win-win strategy.
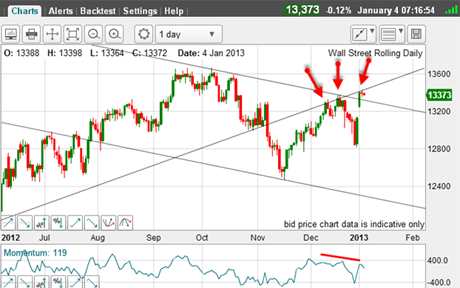
But note that every time the market has hit the underside of the up-sloping trendline,has hita brick wall. This line is the trendline joining the major lows on 4 June 2012 and the October 2012 lows.

(Click on the chart for a larger version)
This line is very significant! The market has hit it three times (red arrows) and is currently challenging it again.
As for my original tramlines, because of the messy action in late December, when the market appeared to ignore the upper line, I am searching for a better fit. I have one suggestion in the above chart.
Two potential scenarios
If my up-sloping trendline holds, I would expect the market to back off inside the upper tramline. This is a realistic scenario given the potential negative momentum divergence (red line on the momentum chart).
And if the market does top out here, that would make the rally off the mid-November low a clear A-B-C.
The alternative scenario is that the upward break of the upper tramline is genuine and the market continues upwards.
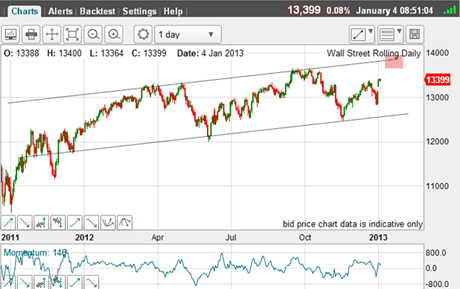
Here is an interesting tramline picture:

(Click on the chart for a larger version)
I have a terrific upper tramline and the lower one is pretty good with the June 2012 low just overshooting a touch.
If these are operating, then my target is the upper tramline in the 13,800 area another 400 pips from current.
Of course, if this does occur, imagine where my T-Bonds will be trading!
But first, the major resistance at the up-sloping trendline in the second chart must be overcome.
Today the market was watching the Non-Farm Payroll data, which the bulls hope will reinforce the generally bullish recent US employment picture.
The moment of truth is at hand!
If you're a new reader, or need a reminder about some of the methods I refer to in my trades, then do have a look at my introductory videos:
The essentials of tramline trading
An introduction to Elliott wave theory
Advanced trading with Elliott waves
Don't miss my next trading insight. To receive all my spread betting blog posts by email, as soon as I've written them, just sign up here . If you have any queries regarding MoneyWeek Trader, please contact us here.
Get the latest financial news, insights and expert analysis from our award-winning MoneyWeek team, to help you understand what really matters when it comes to your finances.
John is is a British-born lapsed PhD physicist, who previously worked for Nasa on the Mars exploration team. He is a former commodity trading advisor with the US Commodities Futures Trading Commission, and worked in a boutique futures house in California in the 1980s.
He was a partner in one of the first futures newsletter advisory services, based in Washington DC, specialising in pork bellies and currencies. John is primarily a chart-reading trader, having cut his trading teeth in the days before PCs.
As well as his work in the financial world, he has launched, run and sold several 'real' businesses producing 'real' products.
-
 Average UK house price reaches £300,000 for first time, Halifax says
While the average house price has topped £300k, regional disparities still remain, Halifax finds.
-
 Barings Emerging Europe trust bounces back from Russia woes
Barings Emerging Europe trust has added the Middle East and Africa to its mandate, delivering a strong recovery, says Max King