Big tramline breaks in the Dow
The Dow has crashed through one line of support only to run up against a stiff line of resistance, says John C Burford. Here, he sets his target for his latest trade.
Get the latest financial news, insights and expert analysis from our award-winning MoneyWeek team, to help you understand what really matters when it comes to your finances.
You are now subscribed
Your newsletter sign-up was successful
Want to add more newsletters?

Twice daily
MoneyWeek
Get the latest financial news, insights and expert analysis from our award-winning MoneyWeek team, to help you understand what really matters when it comes to your finances.

Four times a week
Look After My Bills
Sign up to our free money-saving newsletter, filled with the latest news and expert advice to help you find the best tips and deals for managing your bills. Start saving today!
The 'Barack bounce' didn't last long, did it?The Dow is down around 500 points from last Wednesday's high and has broken through support. Let's see what the picture looks like this morning.
In my Wednesday post, I noted the pick-up in volatility recently then, the market had bounced off my upper tramline once and was heading for it again. I decided to sit on my hands. But minutes after signing off, I had a terrific opportunity for a trade. So out my hands came!
See the below chart for theposition early onWednesday. The market had made it back to the upper tramline, and my question was whether it would dart up through it as the election results were confirmed.
MoneyWeek
Subscribe to MoneyWeek today and get your first six magazine issues absolutely FREE

Sign up to Money Morning
Don't miss the latest investment and personal finances news, market analysis, plus money-saving tips with our free twice-daily newsletter
Don't miss the latest investment and personal finances news, market analysis, plus money-saving tips with our free twice-daily newsletter
Recall I had identified the move down (red bars) as a potential A-B-C move, suggesting rally extension, not a new down move.
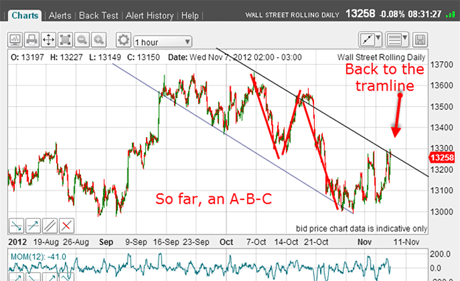
(Click on the chart for a larger version)
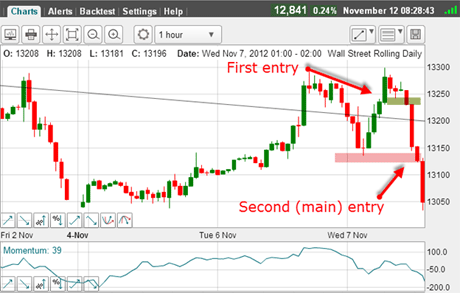
But when the market failed to follow through and drop back to the tramline (which was uncertain), an initial short trade was indicated with a protective stop just above the 13,300 high of the day for a very low risk trade.
This is the grey bar on this hourly chart:
(Click on the chart for a larger version)
As we now know, the market started selling off in earnest and when it broke the significant low just below the 13,250 level, that was the clincher and the second bite of the cherry.
Trader tip: This is a classic example of one of my best entry signals. We were at the upper tramline (resistance).If this tramline could hold further rallies, the confirmation would come if the most recent low could be taken out.This is an excellent spot to enter resting entry stop orders.
The big problem is, of course, where to place protective stops for a low-risk trade.That is why I like to probe entries closer to my suspected turn to have those low-risk entries.But for more conservative traders, the above entry method is ideal.
Very formidable support
OK, let's fast forward to this morning:
(Click on the chart for a larger version)
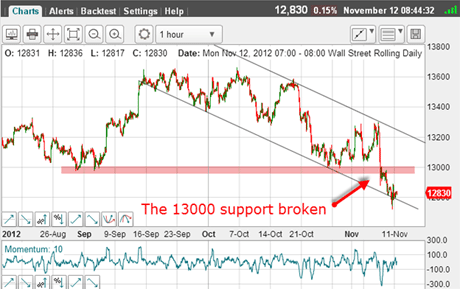
The critical 13,000 support zone gave way on Wednesday as the market headed for my lower tramline with a tremendous overshoot on Friday.
Currently, we are bouncing around this tramline. Shorter-term traders will be looking to take at least some profits off the table here for a very tasty 500-pip or so profit.
Now, we are on a major short-term tramline, and so we must expect a bounce at some stage perhaps back to kiss the 13,000 support?
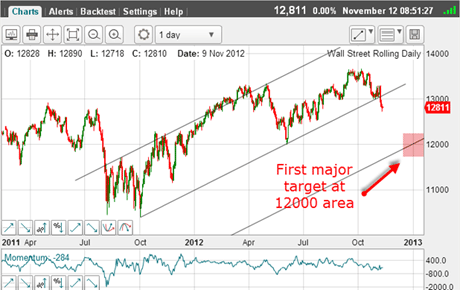
It is time to take a step back from the hourly chart and see where we are on the daily:
(Click on the chart for a larger version)
Here are the tramlines I am working with currently. We had the centre tramline break last week, so that indicates the major move is down and my target is the lowest tramline in the 12,000 region.
But first, the market must negotiate the support provided by the complex congestion zone from the summer's trading.This target is also where the major June low lies.In addition, this is precisely the 50% Fibonacci retrace of the entire move up from last October's low.
I expect this to be very formidable support.
I am often asked why I amtrading from the short side. I refer anyone to my 5 November study of the Nasdaq for clues!
A stupendous Elliott wave
Finally, here are my ideas on the likely Elliott waves:
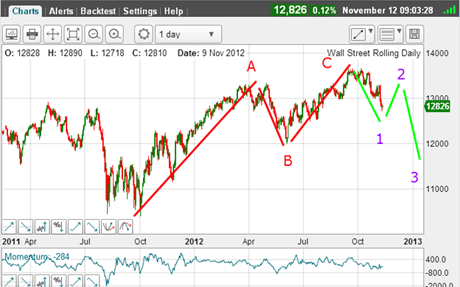
(Click on the chart for a larger version)
The September-October highs were the big C wave top.The current move off this top is wave 1 down (unfinished).The next decent bounce will be wave 2 up, followed by a stupendous wave 3 down which should carry the market below the critical 12,000 low.
This is the scenario I shall be looking for and trading accordingly.
If you're a new reader, or need a reminder about some of the methods I refer to in my trades, then do have a look at my introductory videos:
The essentials of tramline trading
An introduction to Elliott wave theory
Advanced trading with Elliott waves
Don't miss my next trading insight. To receive all my spread betting blog posts by email, as soon as I've written them, just sign up here . If you have any queries regarding MoneyWeek Trader, please contact us here.
Get the latest financial news, insights and expert analysis from our award-winning MoneyWeek team, to help you understand what really matters when it comes to your finances.
John is is a British-born lapsed PhD physicist, who previously worked for Nasa on the Mars exploration team. He is a former commodity trading advisor with the US Commodities Futures Trading Commission, and worked in a boutique futures house in California in the 1980s.
He was a partner in one of the first futures newsletter advisory services, based in Washington DC, specialising in pork bellies and currencies. John is primarily a chart-reading trader, having cut his trading teeth in the days before PCs.
As well as his work in the financial world, he has launched, run and sold several 'real' businesses producing 'real' products.
-
 Average UK house price reaches £300,000 for first time, Halifax says
While the average house price has topped £300k, regional disparities still remain, Halifax finds.
-
 Barings Emerging Europe trust bounces back from Russia woes
Barings Emerging Europe trust has added the Middle East and Africa to its mandate, delivering a strong recovery, says Max King