The fireworks on Friday arrived one trading day early for Bonfire Night, but they were spectacular. Markets were down sharply (except the US dollar, please note). Gold lost $35, silver $1.40, crude oil $1.80 and the Dow almost 200 pips.
And if you were expecting a bullish' US non-farm payroll print, you got it. The number strongly beat expectations.
The trouble is, in recent weeks bad news has been good for stocks (due to more quantitative easing). But on Friday we saw yet another total switch in sentiment, with good news being bad really bad.
Try 6 free issues of MoneyWeek today
Get unparalleled financial insight, analysis and expert opinion you can profit from.

Sign up to Money Morning
Don't miss the latest investment and personal finances news, market analysis, plus money-saving tips with our free twice-daily newsletter
Don't miss the latest investment and personal finances news, market analysis, plus money-saving tips with our free twice-daily newsletter
I refer you to my fable from Friday's articleto illustrate how market sentiment can turn on a sixpence.

This kind of seemingly perverse reaction gives traders/investors who use only fundamental analysis the heebie-jeebies! In fact, many well-known professionals have been calling for record highs in stocks for 2013. Sentiment among this group has been almost off the scale.
Something had to give and we saw a big crack in the bull case on Friday.
Today I will wander off the beaten track and cover the Nasdaq. The long-term Nasdaq chart is extremely interesting. This is a very tradeable market with a little more volatility than the Dow or S&P, but well worth investigating to include in your own menu of markets.
Once in a while, I like to keep an eye on the really big picture decades in length. This gives me a reminder of the huge excesses of optimism and pessimism at big tops and bottoms over the years.
As is well said: "Those who cannot remember the past are condemned to repeat it."
Nowhere in the field of human endeavour is this more apt than in the financial markets.
A striking long-run trade
But there are terrific profit opportunities for those who learn to understand the markets, particularly at times like now.
Let's take a look at the long-term chart of the Nasdaq. Remember, this index contains some of the more speculative shares on the board:
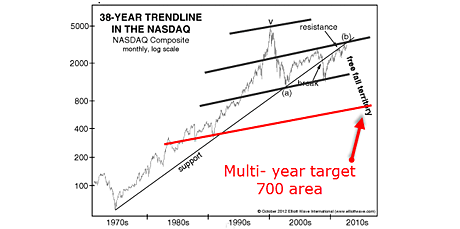
(Chart courtesy of elliottwave.com. Click for a larger version)
This is the market on a log scale from 1970. Just admire the unrelenting (almost) bull market that accelerated in the 1990s as the tech boom gripped investors' imaginations. Many of us can recall the excitement at the time, with crazy valuations for companies that had no real hope of making a penny of profit.
Unlimited riches from internet stocks were the driving force but sadly they existed only in the imagination!
This herding was the culmination of the huge 40-year bull market. Most of us were around for the aftermath of the tech bubble (wave a) as it burst in spectacular fashion in the early 2000s (as the 'Millennium Bug' was shown to be just another figment of the collective imagination, and a fitting end to the hsyteria).
But with central bank injections of liquidity, stocks have recovered in three waves to the current level around 3,200.
I have overlaid my terrific tramlines and the recent rally to the September high (wave b) has just hit my tramline resistance and the underside of the long-term trend-line. This is extra-strong resistance.
If the Elliott wave labels are correct, the red line represents a reasonable target in the 700 area a decline of some 80% from current levels.
This seems outrageous, does it not? I'm sure I will have many opportunities to expand on this theme in the future.
As a point of reference, if the Dow (blue chips) suffers a similar fate, then this target is equivalent to around 2,500.
Of course, even if these targets are approached, it will take years to achieve, with many up and down swings in the meantime. But it gives me a direction to trade for the long pull.
A new short-term target
OK, let's examine the daily chart for clues for immediate direction:
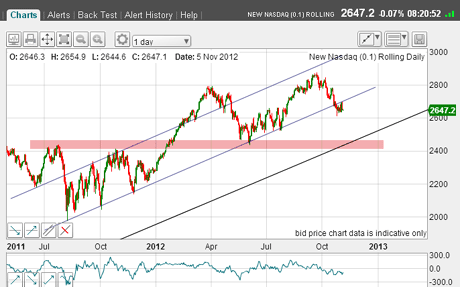
(Click on the chart for a larger version)
I have my tramline trio with a nice upper line prior pivot point, and a centre line with numerous touch-points. I have drawn my lowest line equidistant.
Note this chart is of the Nasdaq 100, while the first chart is the Nasdaq Composite. They are highly correlated.
In late October the market broke below the centre line, it made a kiss last week, and appears to be in the initial stages of a 'scalded cat bounce'.
This morning, it seems the market is heading towards my lowest tramline.
The key level for the long-term is the significant chart support at the pink bar.
Time now to look at the hourly:
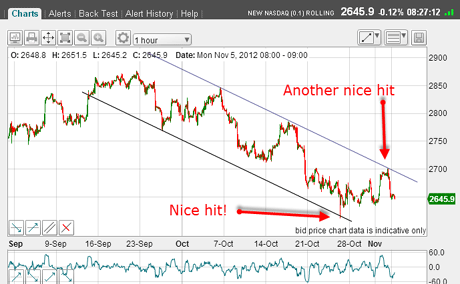
(Click on the chart for a larger version)
The move down off the 22 September high is following the channel between my lines with two nice hits.
The rally Friday was an excellent opportunity to position short as it made the kiss (see above).
The next target on the hourly is the lower line (again).
If the market does rally from here, a move above Friday's high would be of concern to the bearish case, but I will be applying my Fibonacci levels to any rally to find likely reversing points, of course.
Finally, what are the Fibonacci levels telling us?
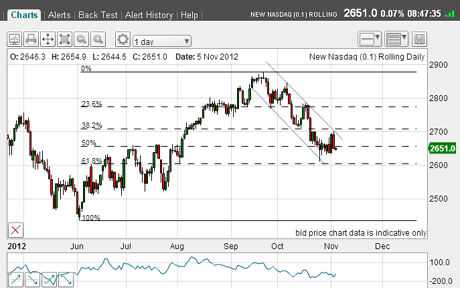
(Click on the chart for a larger version)
This is the big swing off last June's low, and the 25 October low carries almost to the exact 62% level. Note also that the rally off there carried back almost to the 38% level.
We are entering chart support from the congestion zone of last summer, so I expect downside progress from here to be hard-won with decent rallies off the dips.
I hope your trading skills are improving. Remember, I have a series of video tutorials to help you master my techniques see the links below.
If you're a new reader, or need a reminder about some of the methods I refer to in my trades, then do have a look at my introductory videos:
The essentials of tramline trading
An introduction to Elliott wave theory
Advanced trading with Elliott waves
Don't miss my next trading insight. To receive all my spread betting blog posts by email, as soon as I've written them, just sign up here . If you have any queries regarding MoneyWeek Trader, please contact us here.